Here is an overview of sizes in LaTeX: TikZ Usage example: \draw[ultra thick, blue,dashed](a -| current plot begin) — (a); ultra thin very thin thin semithick thick very thick ultra thick Text Usage example: \Huge $\varepsilon$ \tiny \scriptsize \footnotesize \small \normalsize \large \Large \LARGE \huge \Huge Math Usage example: $\scriptstyle \lim_{n \rightarrow \infty} (1 + [...]
Posts Tagged ‘Tikz’
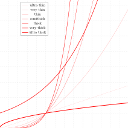
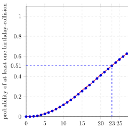
Plotting graphs with PGFplots (LaTeX and Tikz)
I guess many of you might need to plot functions or data once. So I’ve made one example that shows much of the features you might need: You can see how to change the axis’ from normal linear scale to logarithmic scale. Some axis-manipulations were used. I have used a CSV-file to import and plot [...]
My LaTeX Tikz Template
Sometimes I would like to create a single picture with Tikz for later usage on Wikipedia or my Blog. This is my LaTeX Tikz template I use in such a situation: The templates latex-document.tex Standalone Preview-Environment Makefile Requirements LaTeX (How to install the latest LaTeX Version) make Inkscape pdf2svg Test if you meet these requirements [...]
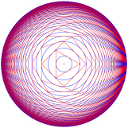
Complex LaTeX visualizations (Tikz)
You can create some very complex visualizations with LaTeX. Take a look at these: Used matlab Source: texample.net Source: texample.net Source: texample.net Source: texample.net Source: texample.net Source: texample.net Source: texample.net Source: texample.net Source: texample.net Source: texample.net Source: texample.net Source: texample.net Do you know more? Please leave a comment! See also Penrose tiling in TikZ Lindenmayer [...]
How to visualize Graph algorithms with LaTeX
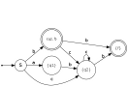
Tkiz is a very powerful TeX package. You can easily create visualizations of graphs and graph algorithms (if you have a template ). This post should give you a template to visualize graph algorithms with LaTeX. I recently found a great animation of Prim’s algorithm done by Kjell Magne Fauske. I’ve edited his source files [...]

