
|
R - A language |
Recent Posts
|
The Collatz sequence |

|
Einführung in die Stochastik |
|
Google Ngram Viewer |

|
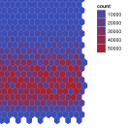
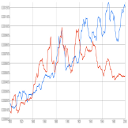
Data Visualization |