Tkiz is a very powerful TeX package. You can easily create visualizations of graphs and graph algorithms (if you have a template 😉). This post should give you a template to visualize graph algorithms with LaTeX. I recently found a great animation of Prim's algorithm done by Kjell Magne Fauske. I've edited his source files to show an eulerian path. This is how it looks like:
This animation was automatically created. See Archive and the intermediate PDF.
The ideas
Draw the Graph
If you want to visualize a graph algorithm, you should first try to get the image of the graph with Tikz. First include all packages / create the general structure of the document:
\documentclass[hyperref={pdfpagelabels=false}]{beamer}
\usepackage{lmodern}

\usepackage[utf8]{inputenc} % this is needed for german umlauts
\usepackage[ngerman]{babel} % this is needed for german umlauts
\usepackage[T1]{fontenc}    % this is needed for correct output of umlauts in pdf

\usepackage{verbatim}
\usepackage{tikz}
\usetikzlibrary{arrows,shapes}

% see http://deic.uab.es/~iblanes/beamer_gallery/index_by_theme.html
\usetheme{Frankfurt}
\usefonttheme{professionalfonts}

\begin{document}
\begin{frame}
    Your content will be here.
\end{frame}
\end{document}
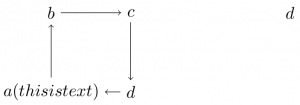
Simple graphs could look like this:
\begin{figure}
    \begin{tikzpicture}[->,scale=1.8, auto,swap]
        % Draw the vertices.
        \node (a) at (0,0) {$a (this is text)$};
        \node (b) at (0,1) {$b$};
        \node (c) at (1,1) {$c$};
        \node (d) at (1,0) {$d$};
        \node (e) at (3,1) {$d$};

        % Connect vertices with edges and draw weights
        \path (a) edge node {} (b);
        \path (b) edge node {} (c);
        \path (c) edge node {} (d);
        \path (d) edge node {} (a);
    \end{tikzpicture}
\end{figure}
You should get something similar to this:
Animate
Animations can be created with Tikz by working with layers. You don't want to redraw the whole graph every time. Most of the time you want to overlay/underlay some parts of the graph. This can be achieved by declaring a new layer:
\pgfdeclarelayer{NAME}
Then you need to tell PGF which layers are to use in the next figure:
\pgfsetlayers{LAYER LIST}
The layer main should always be part of the list. Here is an example:
\pgfdeclarelayer{background}
\pgfdeclarelayer{foreground}
\pgfsetlayers{background,main,foreground}
Now the magic begins. You consecutively add frames to the layer:
    \begin{pgfonlayer}{background}
        \path<2->[draw,line width=5pt,-,red!50] (a.center) edge node {} (b.center);
        \path<10->[draw,line width=5pt,-,red!50] (b.center) edge node {} (d.center);
        \path<12->[draw,line width=5pt,-,red!50] (d.center) edge node {} (e.center);
    \end{pgfonlayer}
The number (2, 10 and 12 in this example) indicate the frame in which it should be added. This is the absolute frame, but 1 is the first frame of the figure environment!
Status quo
\documentclass[hyperref={pdfpagelabels=false}]{beamer}
\usepackage{lmodern}

\usepackage[utf8]{inputenc} % this is needed for german umlauts
\usepackage[ngerman]{babel} % this is needed for german umlauts
\usepackage[T1]{fontenc}    % this is needed for correct output of umlauts in pdf

\usepackage{verbatim}
\usepackage{tikz}
\usetikzlibrary{arrows,shapes}

% see http://deic.uab.es/~iblanes/beamer_gallery/index_by_theme.html
\usetheme{Frankfurt}
\usefonttheme{professionalfonts}

\begin{document}

\pgfdeclarelayer{background}
\pgfdeclarelayer{foreground}
\pgfsetlayers{background,main,foreground}

\begin{frame}
\begin{figure}
    \begin{tikzpicture}[->,scale=1.8, auto,swap]
        % Draw the vertices.
        \node (a) at (0,0) {$a (this is text)$};
        \node (b) at (0,1) {$b$};
        \node (c) at (1,1) {$c$};
        \node (d) at (1,0) {$d$};
        \node (e) at (3,1) {$d$};

        % Connect vertices with edges and draw weights
        \path (a) edge node {} (b);
        \path (b) edge node {} (c);
        \path (c) edge node {} (d);
        \path (d) edge node {} (a);

        \begin{pgfonlayer}{background}
            \path<2->[draw,line width=5pt,-,red!50] (a.center) edge node {} (b.center);
            \path<10->[draw,line width=5pt,-,red!50] (b.center) edge node {} (d.center);
            \path<12->[draw,line width=5pt,-,red!50] (d.center) edge node {} (e.center);
        \end{pgfonlayer}
    \end{tikzpicture}
\end{figure}
\end{frame}
\end{document}
Simplify it
You can make some definitions, e.g.:
draw,line width=5pt,-,red!50
can be replaced by
\tikzstyle{selected edge} = [draw,line width=5pt,-,red!50]
You can make loops:
    % Draw the vertices.
    \foreach \pos / \identifier / \name in {{(0,0)/a/a (this is text)},
        {(0,1)/b/b}, {(1,1)/c/c}, {(1,0)/d/d}, {(3,1)/e/d}}
        \node (\identifier) at \pos {$\name$};
The whole, working template
\documentclass[hyperref={pdfpagelabels=false}]{beamer}
\usepackage{lmodern}

\usepackage[utf8]{inputenc} % this is needed for german umlauts
\usepackage[ngerman]{babel} % this is needed for german umlauts
\usepackage[T1]{fontenc}    % this is needed for correct output of umlauts in pdf

\usepackage{verbatim}
\usepackage{tikz}
\usetikzlibrary{arrows,shapes}

% Define some styles for graphs
\tikzstyle{vertex}=[circle,fill=black!25,minimum size=20pt,inner sep=0pt]
\tikzstyle{selected vertex} = [vertex, fill=red!24]
\tikzstyle{blue vertex} = [vertex, fill=blue!24]
\tikzstyle{edge} = [draw,thick,-]
\tikzstyle{weight} = [font=\small]
\tikzstyle{selected edge} = [draw,line width=5pt,-,red!50]
\tikzstyle{ignored edge} = [draw,line width=5pt,-,black!20]

% see http://deic.uab.es/~iblanes/beamer_gallery/index_by_theme.html
\usetheme{Frankfurt}
\usefonttheme{professionalfonts}

% disables bottom navigation bar
\beamertemplatenavigationsymbolsempty

% http://tex.stackexchange.com/questions/23727/converting-beamer-slides-to-animated-images
\setbeamertemplate{navigation symbols}{}%

\begin{document}
\pgfdeclarelayer{background}
\pgfsetlayers{background,main}

\begin{frame}
    \begin{figure}
        \begin{tikzpicture}[->,scale=1.8, auto,swap]
            % Draw the vertices. First you define a list.
            \foreach \pos/\name in {{(0,0)/a}, {(0,2)/b}, {(1,2)/c},
                                    {(1,0)/d}, {(2,1)/e}, {(3,1)/f},
                                    {(4,2)/g}, {(5,2)/h}, {(4,0)/i},
                                    {(5,0)/j}}
                \node[vertex] (\name) at \pos {$\name$};

            % Connect vertices with edges and draw weights
            \foreach \source/ \dest /\pos in {a/b/, b/c/, c/d/, d/a/,
                                        c/e/bend left, d/e/, e/c/,
                                        e/f/, f/g/, f/i/,
                                        g/f/bend right, i/f/bend left,
                                        g/h/, h/j/, j/i/, i/g/}
                \path (\source) edge [\pos] node {} (\dest);

            % Start animating the edge selection.
            % For convenience we use a background layer to
            % highlight edges. This way we don't have to worry about
            % the highlighting covering weight labels.
            \begin{pgfonlayer}{background}
                \foreach \source / \dest / \fr / \pos in {d/a/1/,
                        a/b/2/, b/c/3/, c/d/4/, d/e/5/, e/c/6/,
                        c/e/7/bend left, e/f/8/, f/g/9/,
                        g/f/10/bend right, f/i/11/, i/g/12/, g/h/13/,
                        h/j/14/, j/i/15/, i/f/16/bend left}
                    \path<\fr->[selected edge] (\source.center) edge
                                        [\pos] node {} (\dest.center);
            \end{pgfonlayer}
        \end{tikzpicture}
    \end{figure}
    Lorem ipsum dolor sit amet, consetetur sadipscing elitr,
    sed diam nonumy eirmod tempor invidunt ut labore et dolore
    magna aliquyam erat, sed diam voluptua. At vero eos et
    accusam et.
\end{frame}
\end{document}
Resources
- TikZ and pgf: Manual for version 1.18
- TeXamples.net: Great page with many Tikz-Examples
- The beamer class