I've recently got a request to expand my analysis of the Python Package Index commonly known as PyPI. It is a repository of Python packages where everybody can upload packages; pretty much without any restriction. In the article Analyzing PyPI Metadata you can read some general stuff about the repository.
This article is going a bit more deeper. This time I don't only analyze the metadata, but the relationship of the packages themselves. I wanted to build a dependency graph. However, here is a downside of Pythons package structure: The file which defines the dependencies of a Python package is a Python script itself. This gives the package developer the highest flexibility, but it also gives them the power to execute arbitrary code when I only want to get the dependencies.
As I am pretty sure there are some malicious packages in the repository (Although I've never heard of a single one there has to be one. Over 50 000 packages by 2015 - there has to be one!). So I don't want to execute any code of the repository without having at least a clue what it should do. This means my analysis is very simple and thus prone to some errors.
Most common single dependency
One can see dependencies as being weighted by the number of times a package imports the package.
Non-weighted
SELECT
    `packages`.`name`,
    COUNT(`needs_package`)
FROM
    `dependencies`
JOIN
    `packages` ON `needs_package` = `packages`.`id`
GROUP BY
    `needs_package`
ORDER BY
    COUNT(`needs_package`) DESC
LIMIT 20
which gives
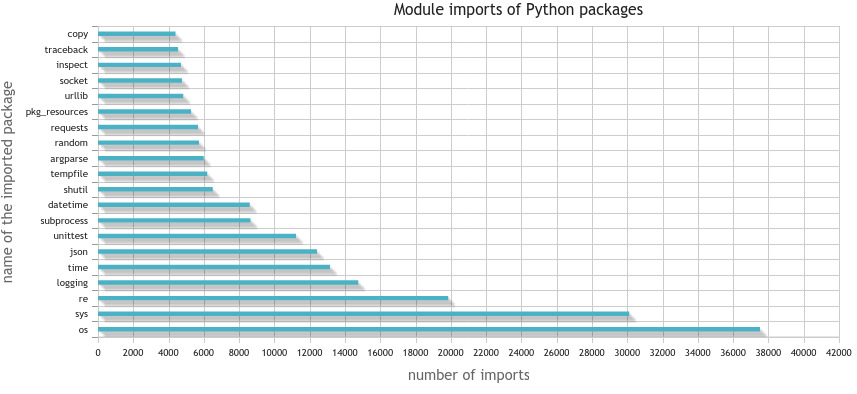
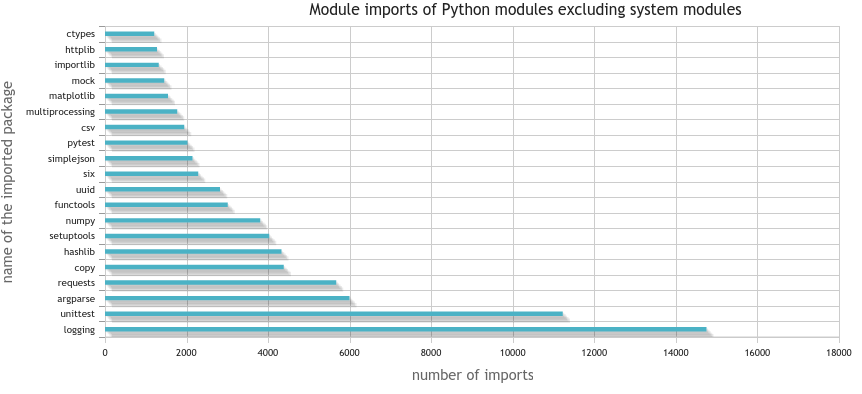
and without the system packages:
SELECT
    `packages`.`name`,
    COUNT(`needs_package`)
FROM
    `dependencies`
JOIN
    `packages` ON `needs_package` = `packages`.`id`
WHERE
    `on_pypi` = 1
GROUP BY
    `needs_package`
ORDER BY
    COUNT(`needs_package`) DESC
LIMIT 20
which gives
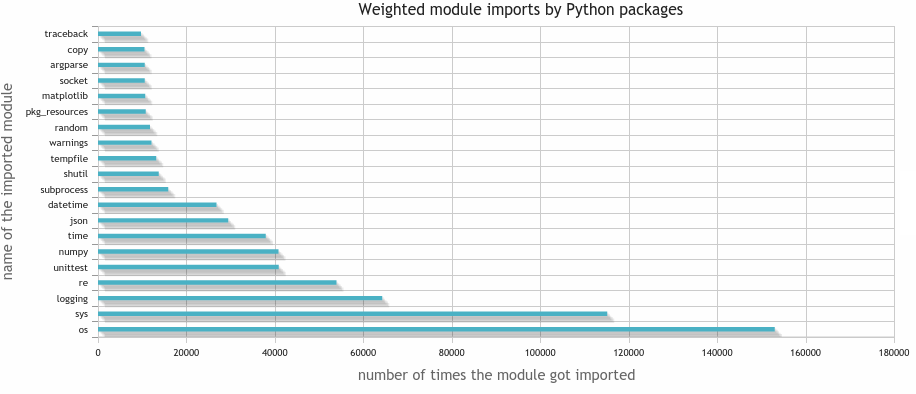
Weighted
How often gets a single module included over all packages?
SELECT
    `packages`.`name`,
    SUM(`times`)
FROM
    `dependencies`
JOIN
    `packages` ON `needs_package` = `packages`.`id`
GROUP BY
    `needs_package`
ORDER BY
    SUM(`times`) DESC
LIMIT 20
2 seconds later I've got the result:
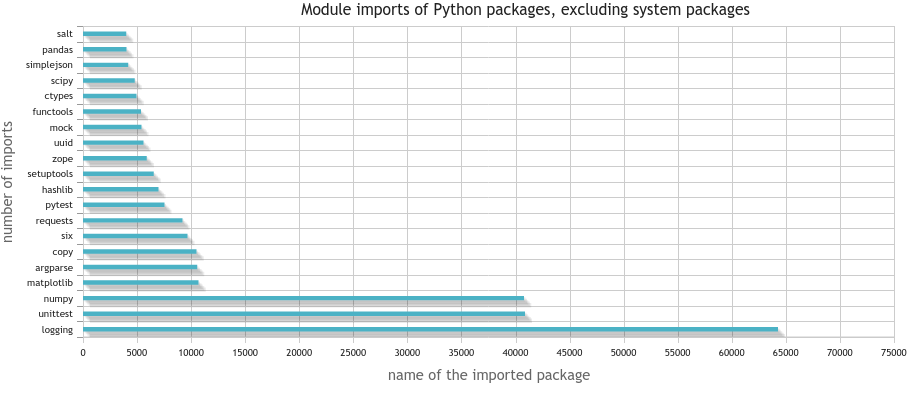
If I'm only interested in the packages which are on PyPI, hence not system packages, I execute the following query:
SELECT
    `packages`.`name`,
    SUM(`times`)
FROM
    `dependencies`
JOIN
    `packages` ON `needs_package` = `packages`.`id`
WHERE
    `on_pypi` = 1
GROUP BY
    `needs_package`
ORDER BY
    SUM(`times`) DESC
LIMIT 20
which gives me about 2 seconds later the following result:
Non-functional packages
Although there are many packages for Python which are very useful, there are also quite a lot which are not usefull at all. One possibility to identify such packages is by checking which packages get neither used by others nor use other packages
SELECT
    `packages`.`id`, `name`
FROM `packages`
WHERE
    `id` in (
        SELECT DISTINCT
            `dependencies`.`package`
        FROM
            dependencies)
OR `id` in (
        SELECT DISTINCT
            `dependencies`.`needs_package`
        FROM
            `dependencies`)
This leads to the result that 54 900 packages of 67 582 packages are not obviously crap. Or to write it in another way: 11 682 packages are crap. That is 17.5 %. Too much, in my opinion. However, this might also be due to my crappy script not downloading / checking the downloaded files correctly.
Names
One thing I was interested in while downloading all those packages was the question if there are malicious packages (either on purpose or by accident). One undesirable thing that could happen would be very similar names.
Prefixes
Let's see how many packages are prefixes of other packages. My thought was that this might be developers trying to get some accidential installs. However, it only showed some relationships. I wanted to make a Levensthein distance analysis, but I guess this is not worth it.
Here are the top 10 strings which are prefixes of packages and packages themselves:
- djan: 6462
- pyt: 1626
- pyth: 1278
- collect: 1155
- Flask: 561
- open: 474
- pyr: 442
- pyp: 295
- pyra: 285
- pym: 256
One interesting thing I've learned is that you can use pip like this:
$ pip search "djan$"
... and I found a pip bug (github.com/pypa/pip/issues/3327)
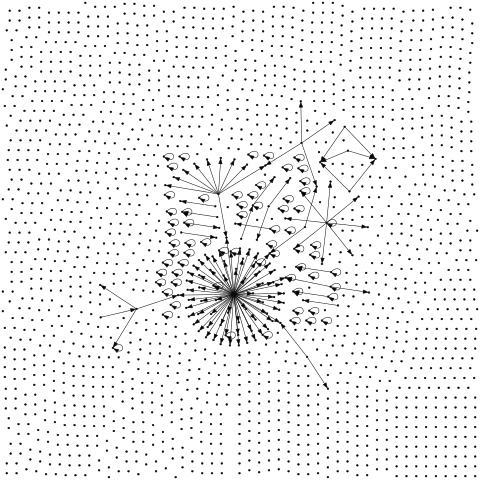
Graph analysis
Analyzing the dependency graph is quite a challenge. Or at least that was what I initiallly thought. This graph has about 67 582 nodes and 436 980 edges. Quite a bit. Definitely much larger than what I have previously used.
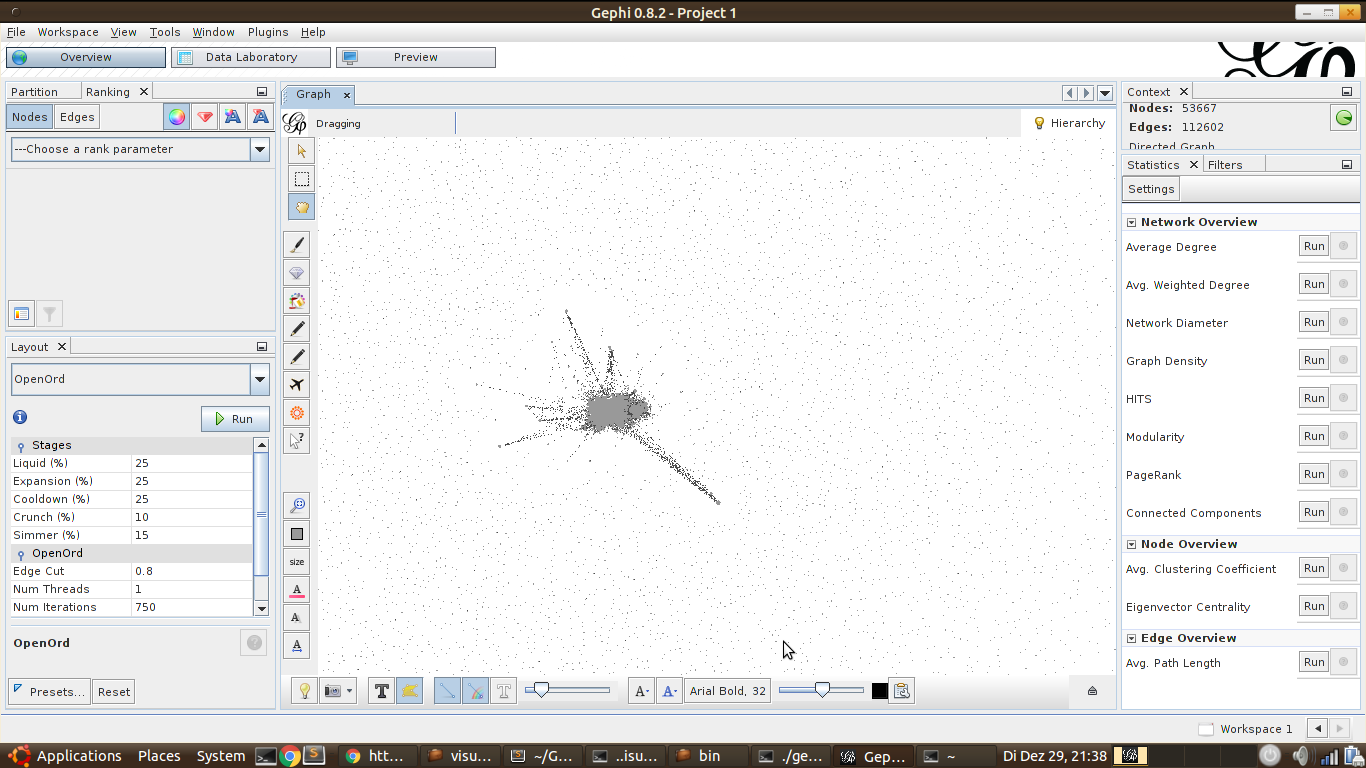
However, my friend Nilan who knows a lot about graphs send me a link to StackOverflow: Visualizing Undirected Graph That's Too Large for GraphViz?
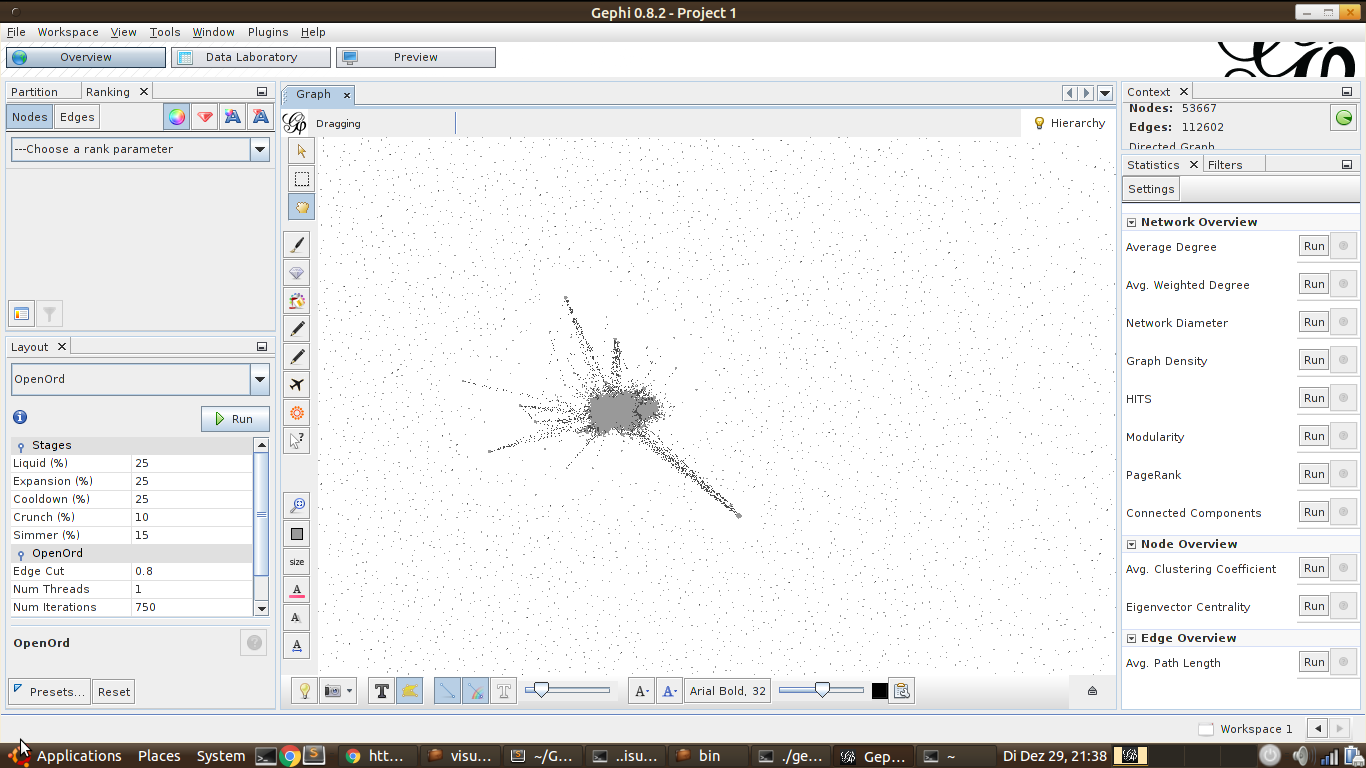
This lead me to Gephi and the OpenOrd layout plugin. It didn't work for the complete graph (see issues/1207), it worked after I removed the single nodes without edges.
Now we can ask several standard questions about graphs:
- How many connected components are there?
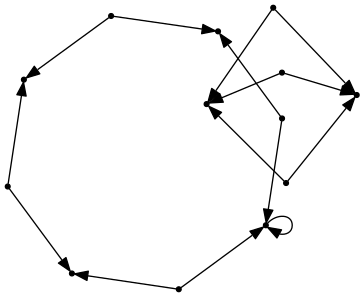
- Are there any circles? (That would be bad... dependency graphs should not have circles. Similar to family trees.)
- Which are the most central nodes?
I didn't find the time to answer those, but I put the graph data in JSON format on github.com/MartinThoma/pypi-dependencies. Please let me know when you do something interesting with the data.
I've only got some crappy images with Gephi / GraphViz:


Code
See github.com/MartinThoma/algorithms.
What could come next
I would like too measure the overall code quality on PyPI in another post. I think of the following measures:
- pyroma: A 10-point score for packages
- package goodness with Cheesecake,
- pylint
- PEP8 conformance,
- Lines of code (LOC) / documentation / whitespace
- Docstring style (None, NumpyDoc, Sphinx, Google - see Python Code Documentation)
- Usage of functions
- Testing coverage
- Look for URLs in the code and which are reachable / which are not
- Look for non-Python files
See also
- Analysis of PyPI
- K. Gullikson: Python Dependency Analysis: A well-written article with some very nice images.
- O. Girardot: State of the Python/PyPI Dependency Graph: One very nice, interactive image of the dependency graph.
- Building big graphs