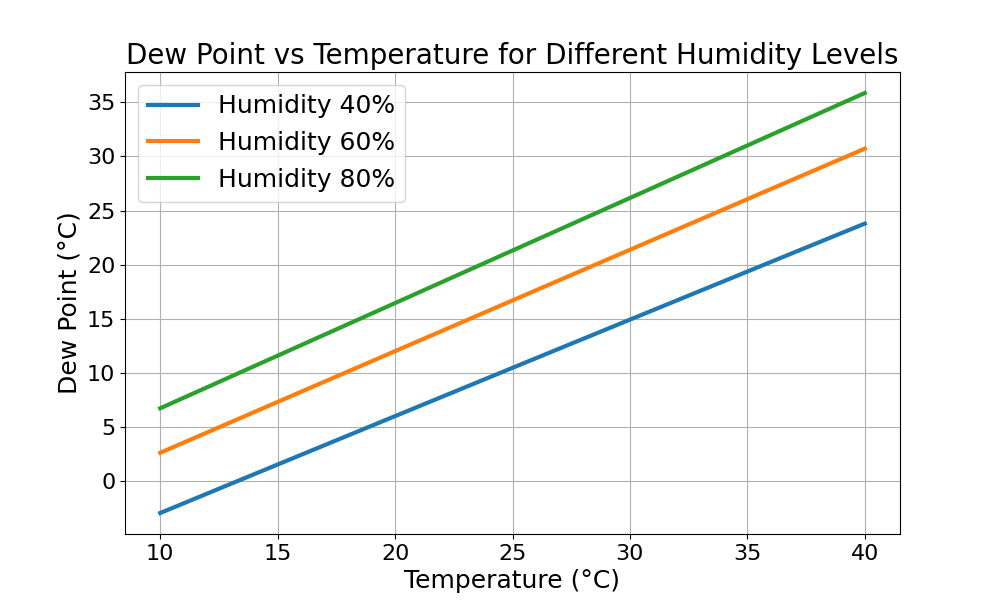
The dew point is important for home owners as it's the deciding factor if you get mold.
It's a combination of temperature in the room, humidity in the room, and the temperature of colder surfaces. As this is typically the window, I will now only mention the window.
The gist of it: Condensation happens, when
- ... the humidity is higher
- ... the outside temperature (and thus the window) is colder
- ... the inside temperature is higher
Here you can see the temperatures:

A few ones:
- If you have a humidity of 40%, the dew-point is:
- For 20°C room temperature at 6°C
- For 25°C room temperature at 10°C
- For 30°C room temperature at 15°C
- If you have a humidity of 50%, the dew-point is:
- For 20°C room temperature at 9°C
- For 25°C room temperature at 14°C
- For 30°C room temperature at 18°C
- If you have a humidity of 75%, the dew-point is:
- For 20°C room temperature at 15°C
- For 25°C room temperature at 20°C
- For 30°C room temperature at 25°C
Created via
import typer  # pip install typer
import math
import numpy as np  # pip install numpy
import matplotlib.pyplot as plt  # pip install matplotlib
from mpl_toolkits.mplot3d import Axes3D


def calculate_dew_point(temperature: float, humidity: float) -> float:
    """
    Calculate dew point using temperature and relative humidity

    Formula source: https://en.wikipedia.org/wiki/Dew_point#Calculating_the_dew_point
    1974 Psychrometry and Psychrometric Charts
    """
    a = 17.27
    b = 237.7  # °C

    alpha = ((a * temperature) / (b + temperature)) + np.log(humidity / 100.0)

    dew_point = (b * alpha) / (a - alpha)
    return dew_point  # round(dew_point, 2)


def plot2d():
    # Generate temperature values
    temperature_values = np.linspace(10, 40, 100)

    # Calculate dew point for different humidity levels
    humidity_levels = [40, 60, 80]

    # Create a 2D plot
    plt.figure(figsize=(10, 6))

    for humidity in humidity_levels:
        dew_point_values = [
            calculate_dew_point(temp, humidity) for temp in temperature_values
        ]
        label = f"Humidity {humidity}%"
        plt.plot(temperature_values, dew_point_values, label=label, linewidth=3.0)

    # Label the axes
    plt.xlabel("Temperature (°C)", fontsize=18)
    plt.ylabel("Dew Point (°C)", fontsize=18)

    # Increase the font size of tick labels
    plt.xticks(fontsize=16)
    plt.yticks(fontsize=16)

    # Add a legend
    plt.legend(fontsize=18)

    # Show the plot
    plt.grid(True)
    plt.title("Dew Point vs Temperature for Different Humidity Levels")
    plt.show()


def plot3d():
    # Generate data points
    temperature_values = np.linspace(10, 40, 50)
    humidity_values = np.linspace(0, 100, 50)

    temperature_mesh, humidity_mesh = np.meshgrid(temperature_values, humidity_values)
    dew_point_values = calculate_dew_point(temperature_mesh, humidity_mesh)

    # Create 3D plot
    fig = plt.figure()
    ax = fig.add_subplot(111, projection="3d")

    # Plot the surface
    surf = ax.plot_surface(
        temperature_mesh, humidity_mesh, dew_point_values, cmap="viridis", edgecolor="k"
    )

    # Label the axes
    ax.set_xlabel("Temperature (°C)")
    ax.set_ylabel("Humidity (%)")
    ax.set_zlabel("Dew Point (°C)")

    # Add a color bar
    fig.colorbar(surf, ax=ax, shrink=0.5, aspect=10)

    # Show the plot
    plt.show()

    # Save the plot as a PNG image
    fig.savefig("dew_point_graph.png")


def main(temperature: float, humidity: float):
    dew_point = calculate_dew_point(temperature, humidity)
    typer.echo(
        f"The dew point at {temperature}°C and {humidity}% humidity is {dew_point}°C"
    )
    plot2d()
    # plot3d()


if __name__ == "__main__":
    typer.run(main)