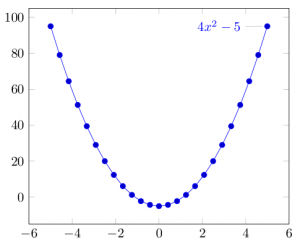
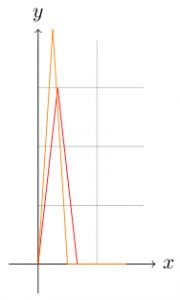
It's crazy how much time I have wasted today just for searching for a working example how to plot a function within LaTeX. Here are two complete examples which worked for me.
I have used this command to generate the PDF-file:
pdflatex latex.tex -output-format=pdf
gnuplot

\documentclass{article}

\usepackage{tikz}
\usepackage{pgfplots}

\begin{document}
    \begin{tikzpicture}
        \begin{axis}
            \addplot+[id=parable,domain=-5:5]
            gnuplot{4*x**2 - 5}
            node[pin=180:{$4x^2-5$}]{};
        \end{axis}
    \end{tikzpicture}
\end{document}
tikzpicture

\documentclass{article}

\usepackage{tikz}

\begin{document}
    \begin{tikzpicture}
          \draw[very thin,color=gray] (0.0,0.0) grid (1.8,3.8);

          \draw[->] (-0.5,0) -- (2,0) node[right] {$x$};
          \draw[->] (0,-0.5) -- (0,4) node[above] {$y$};

          \draw [domain=0:1/3,red] plot (\x,3*3*\x);
          \draw [domain=1/3:2/3,red] plot (\x,2*3-3*3*\x);
          \draw [domain=2/3:1.5,red] plot (\x,0);

          \draw [domain=0:1/4,orange] plot (\x,4*4*\x);
          \draw [domain=1/4:2/4,orange] plot (\x,2*4-4*4*\x);
          \draw [domain=2/4:1.5,orange] plot (\x,0);
    \end{tikzpicture}
\end{document}
Floating text
If you want to wrap the text around the graph, you can use wrapfigure:
\documentclass{article}

\usepackage{tikz}
\usepackage{pgfplots}
\usepackage{wrapfig}

\begin{document}
\begin{wrapfigure}{r}{.2\textwidth}
  \begin{center}
    \begin{tikzpicture}
          \draw[->] (-0.5,0) -- (2,0) node[right] {$x$};
          \draw[->] (0,-0.5) -- (0,4) node[above] {$y$};
          \draw [domain=0:1/3,red] plot (\x,3*3*\x);
          \draw [domain=1/3:2/3,red] plot (\x,2*3-3*3*\x);
          \draw [domain=2/3:1.5,red] plot (\x,0);

          \draw [domain=0:1/4,orange] plot (\x,4*4*\x);
          \draw [domain=1/4:2/4,orange] plot (\x,2*4-4*4*\x);
          \draw [domain=2/4:1.5,orange] plot (\x,0);
    \end{tikzpicture}
  \end{center}
\end{wrapfigure}

Lorem ipsum dolor sit amet, consectetur adipiscing elit. Duis congue dictum elit. Morbi ultricies laoreet massa, sed sagittis lorem laoreet et. Donec at erat non sem tristique rutrum vel vel justo. Vestibulum tincidunt pulvinar mi, a congue purus dignissim vel. Ut porttitor dignissim neque eget rutrum. Nunc gravida varius semper. Quisque et purus quam. Quisque ultricies tristique magna sit amet egestas. Mauris bibendum lacus semper justo consectetur blandit vitae non nisi. Etiam non augue nec est facilisis tempor. Nullam non diam vel erat fermentum gravida. Proin tincidunt turpis lobortis ante elementum suscipit. Curabitur congue, dolor fringilla feugiat blandit, quam libero euismod purus, eget commodo erat nibh a augue. Vestibulum ut tellus ac arcu semper facilisis.
\end{document}
PSTricks
I have found some very nice example images, but no working LaTeX-Code.
Read more
- Wikibooks: LaTeX/Floats, Figures and Captions
- Manual for pgfplots with lots of examples (as images and LaTeX in over 300 pages!)
- TeXample.net: GNUPLOT basics, Parameterized plots, Pgfplots