Once in a while I have to visualize simple 1D numerical data. So here is an example script:
#!/usr/bin/env python
# -*- coding: utf-8 -*-
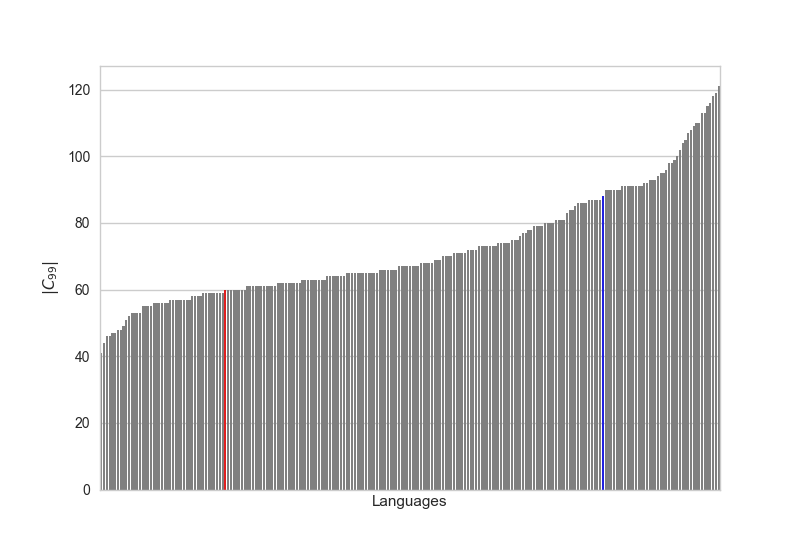
"""Visualize C_0.99 for all languages except the 10 with most characters."""
import matplotlib.pyplot as plt
import seaborn as sns
sns.set_style("whitegrid")
def plot_1d(l, colors=None, xlabel="", ylabel=""):
"""Plot a 1D list l of numbers."""
ax = sns.barplot([i for i in range(len(l))], l, palette=colors)
ax.set(xlabel=xlabel, ylabel=ylabel, label="big")
ax.set_xticks([])
plt.savefig("example.pdf")
plt.savefig("example.png")
plt.show()
if __name__ == "__main__":
l = [41, 44, 46, 46, 47, 47, 48, 48, 49, 51, 52, 53, 53, 53, 53, 55, 55,
55, 55, 56, 56, 56, 56, 56, 56, 57, 57, 57, 57, 57, 57, 57, 57, 58,
58, 58, 58, 59, 59, 59, 59, 59, 59, 59, 59, 60, 60, 60, 60, 60, 60,
60, 60, 61, 61, 61, 61, 61, 61, 61, 61, 61, 61, 61, 62, 62, 62, 62,
62, 62, 62, 62, 62, 63, 63, 63, 63, 63, 63, 63, 63, 63, 64, 64, 64,
64, 64, 64, 64, 65, 65, 65, 65, 65, 65, 65, 65, 65, 65, 65, 65, 66,
66, 66, 66, 66, 66, 66, 67, 67, 67, 67, 67, 67, 67, 67, 68, 68, 68,
68, 68, 69, 69, 69, 70, 70, 70, 70, 71, 71, 71, 71, 71, 72, 72, 72,
72, 73, 73, 73, 73, 73, 73, 73, 74, 74, 74, 74, 74, 75, 75, 75, 76,
77, 77, 78, 78, 79, 79, 79, 79, 80, 80, 80, 80, 81, 81, 81, 81, 83,
84, 84, 85, 86, 86, 86, 86, 87, 87, 87, 87, 87, 88, 90, 90, 90, 90,
90, 90, 91, 91, 91, 91, 91, 91, 91, 91, 92, 92, 93, 93, 93, 94, 95,
95, 96, 98, 98, 99, 100, 102, 104, 105, 107, 108, 109, 110, 110, 113,
113, 115, 116, 118, 119, 121]
colors = []
en_found = False
for value in l:
if value == 60 and not en_found: # eng
colors.append("red")
en_found = True
elif value == 88: # rus
colors.append("blue")
else:
colors.append("grey")
plot_1d(l, colors, xlabel="Languages", ylabel="$|C_{99}|$")
which gives
Prerequesites
You need to install seaborn.