I am currently involved in a software project and I should create a Gantt chart. So I've searched for tools that allow me to do so, but it was astonishingly difficult to find good tools. I'm not completely content with any of them, but I would like to share my experiences.
Gantter
Overview
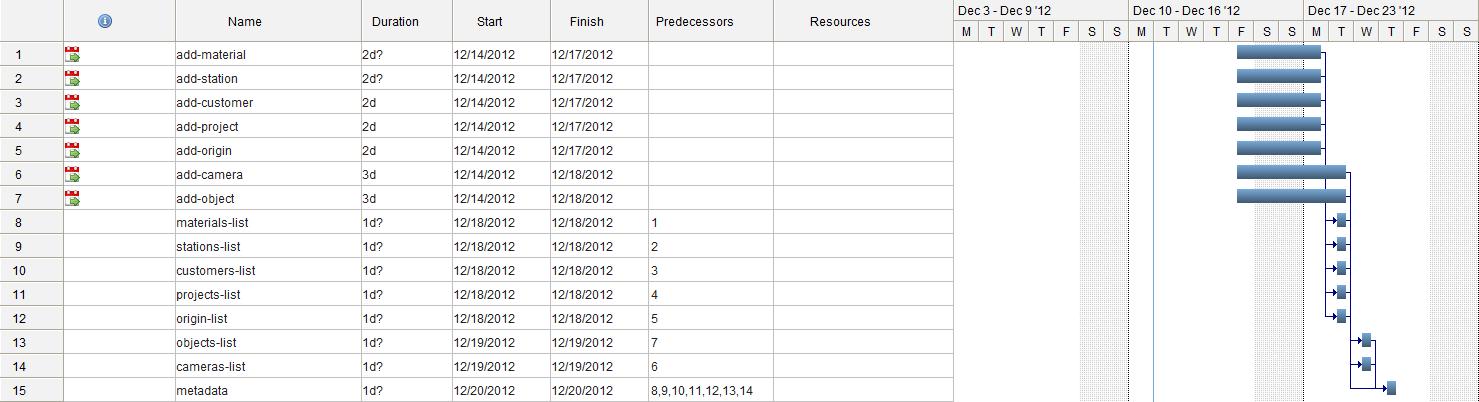
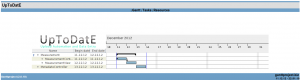
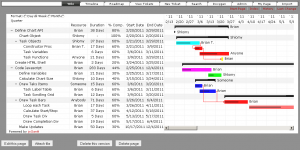
Gantter is a free online tool that allows you to create Gantt charts.
It looks like this:
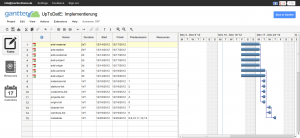
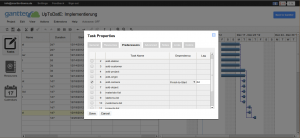
It is easy to use and has a good interface. I can simply define depencies:
Export
Gantter offers some export options: HTML, PDF, PNG, MS-Project (.xml). All export options I've tried are unconvincing. I couldn't save the HTML export, the PDF export was splitted over several pages and the PNG ... well, it's a PNG. As I am currently on a Linux machine, I can't try the MS-Project export.
Google Drive
Gantter also has a Google Drive integration, but it requests these permissions:
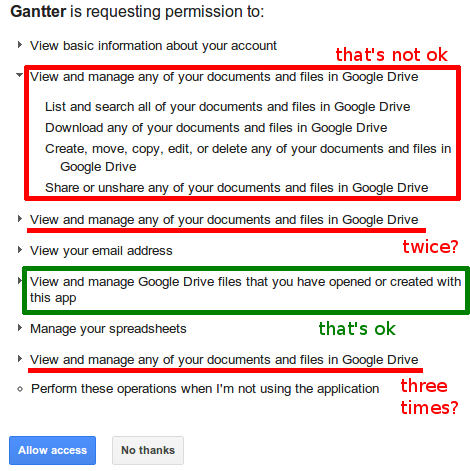
I have contacted them today (11.12.2012) and asked why they want these permissions. I'll update this post as soon as I get an answer.
My recommendation: Don't give them those rights! You can create an account without a Google Drive permission.
GanttProject
GanttProject is a Java Gantt chart program (as you might have noticed because of the SWING design):
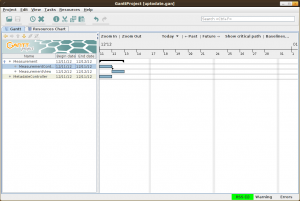
It's quite good, but sometimes I got the feeling that it doesn't instantly response. It's perhaps imagination as I always think that of Java projects.
The HTML-export is not so good. It basically converts the chart to an image and embeds this into a HTML page. This is not what I thought of! This way, you can't search or copy the tasks. You also can't see more information about the task.
GNOME Planner
Planner is part of GNOME.
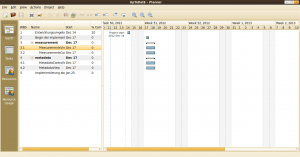
This is how you create a new task:
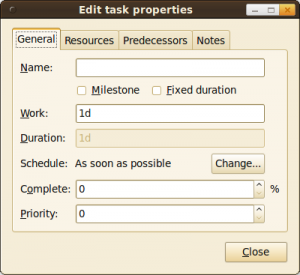
It is very annoying that you always have to click on "Change", then on "As soon as possible" change it to "fixed date" and then you can click on a date. Why don't you allow the user to click on a date and when he does, change it automatically to "fixed date"?
The HTML-export is good, but I would also like to click on a tasks' bar and get the associated task highlighted (and perhaps some additional information).
Trac jsGantt plugin
You can let Trac automatically create a Gantt chart with Trac jsGantt plugin. According to this link, it should look like this:
I knew that I had to install the MasterTicketsPlugin to make it possible to add ticket dependencies. With that, it looked like this:
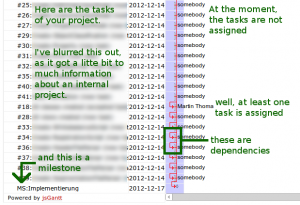
Not quite what I've expected. So I guess I will also need SubticketsPlugin and TimingAndEstimationPlugin.
Update: These Trac-Plugins are crap. The Gantt-Chart that was created looks ugly and doesn't look like I've expected.
LaTeX
pgfgantt
This piece of LaTeX:
\documentclass{article}
\usepackage[pdftex,active,tightpage]{preview}
\setlength\PreviewBorder{2mm}
\usepackage{pgfgantt}

\begin{document}
\begin{preview}
    \begin{ganttchart}{12}
    \gantttitle{2012}{12} \\
    \gantttitlelist{1,...,12}{1} \\
    \ganttgroup{Group 1}{1}{7} \\
    \ganttbar{Task 1}{1}{2} \\
    \ganttlinkedbar{Task 2}{3}{7} \ganttnewline
    \ganttmilestone{Milestone}{7} \ganttnewline
    \ganttbar{Final Task}{8}{12}
    \ganttlink{elem2}{elem3}
    \ganttlink{elem3}{elem4}
    \end{ganttchart}
\end{preview}
\end{document}
generates this Gantt chart:
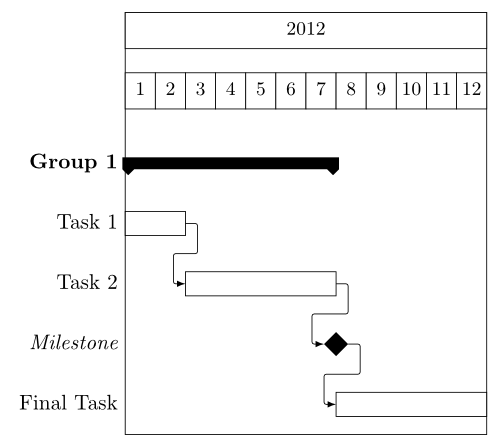
Source is here.
Another LaTeX Gantt chart solution
This source:
\documentclass{article}
\usepackage[pdftex,active,tightpage]{preview}
\setlength\PreviewBorder{2mm}
\usepackage{gantt}

\begin{document}
\begin{preview}
  \begin{gantt}{10}{12}
    \begin{ganttitle}
    \numtitle{1}{1}{12}{1}
    \end{ganttitle}
    \ganttbar{a task}{0}{2}
    \ganttbarcon{a consecutive task}{2}{4}
    \ganttbarcon{another consecutive task}{8}{2}
    \ganttmilestone[color=cyan]{Milestone with color!}{4}
    \ganttbar{another task}{2}{2}
    \ganttbar[color=cyan]{another coloured task}{4}{4}
    \ganttbar{another task}{4}{2}
    \ganttcon{4}{5}{4}{7}
    \ganttmilestonecon{A connected Milestone}{7}
    \ganttbarcon{another consecutive task}{8}{2}
  \end{gantt}
\end{preview}
\end{document}
creates
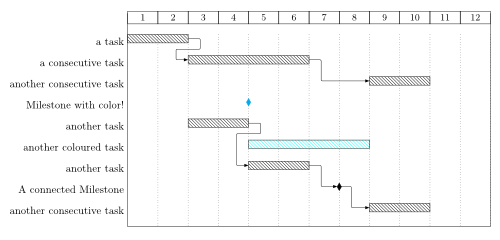
Full source is here.
Although the result looks very nice, I don't think LaTeX is an optimal solution for Gantt charts of software projects. Yes, you get a great result. But it takes a lot of time and after a week or so this particular chart is definitely outdated. You can't add more information directly as you could do it with HTML tooltips. I don't know if you can produce a linked PDF, but I guess this would be quite a lot of manual work.
More tools
ProjectLibre was recommended to me, but it is not in the Ubuntu repository ☹
Conclusion
LaTeX rulez. If you want nice looking results, you should definitely use LaTeX. Although I think combining an automatically generated Gantt-chart with tickes would be nice, this seems not to be possible by now.