In machine learning, the "curse of dimensionality" is often stated but much less often explained. At least not in detail. One just gets told that points are farer away from each other in high dimensional spaces.
Maximum minimal distance
One approach to this is to calculate the maximum minimal distance of $k$ points in $[0, 1]^n$. So you try to place $k$ points in such a way, that the minimum over the pairwise distances of those $k$ points is maximal. Let's call this $\alpha(n, k)$. However, it is not easily possible to calculate $\alpha(n, k)$ for arbitrary $n > 2$ and $k > 2$ (see link). But the special case $k = 2$ and $k = 2^n$ is easy:
- $\alpha(n, 2) = \sqrt{n}$
- $\alpha(n, 2^n) = 1$
So you can see that two points get can be farer apart in higher dimensions and that it needs much more points in higher dimensions to force at least two of them to have distance 1.
Average distance
Another approach is to calculate the average distance of $k$ uniformly randomly sampled points in $[0, 1]^n$. Let's call it $\beta(n, k)$.
One first insight is that $\beta(n, k) = \beta(n, j)$ for and $k, j \geq 2$. Hence we will only use $\beta(n)$ in the following.
It is possible to calculate this, but it is rather tedious (link).
Just two calculated solutions for $k=2$ points:
- $\beta(1) = \frac{1}{3}$
- $\beta(2) = \frac{2+\sqrt{2}+5\operatorname{arcsinh}(1)}{15}=\frac{2+\sqrt{2}+5\log(1+\sqrt{2})}{15} \approx 0.52140543316472\ldots$
However, it is pretty easy to simulate it.
Density of Hypercubes
One interesting question is how much of the $n$-dimensional hypercube can be filled by one inscribed $n$-dimensional hyperball.
The volume of an $n$-dimensional hypercube is $V_C(a) = a^n$ where $a$ is the cubes side length. So for 1 dimension it is $a$, for 2 dimensions (a square) it is $a^2$, for 3 dimensions it is $a^3$ (a cube).
The volume of an $n$-dimensional ball is
$$V_S(r) = r^n \frac{\pi^{n/2}}{\Gamma (\frac{n}{2} + 1)}$$
Source: Wikipedia
So for 1 dimension it is $r \frac{\sqrt{\pi}}{\Gamma(1.5)} = r \frac{\sqrt{\pi}}{0.5 \Gamma(0.5)} = 2r$,
for 2 dimensions it is $r^2 \frac{\pi}{\Gamma (2)} = r^2 \frac{\pi}{\Gamma (1)} = r^2 \pi$
and for 3 dimensions it is $r^3 \frac{\pi^{3/2}}{\Gamma (\frac{5}{2})} = r^3 \frac{\pi^{3/2}}{1.5 \cdot 0.5 \cdot \Gamma (\frac{1}{2})} = r^3 \frac{\pi}{\frac{3}{4}}$.
This means the percentage of space of a unit hypercube which can be filled by the biggest inscribed hyperball is
$$ \begin{align} \frac{V_S(0.5)}{V_C(1)} &= \frac{r^n \frac{\pi^{n/2}}{\Gamma (\frac{n}{2} + 1)}}{1} \ &= \frac{0.5^n \pi^{n/2}}{\Gamma (\frac{n}{2} + 1)} \ &= \frac{0.5^n \pi^{n/2}}{\frac{n}{2} \cdot \Gamma (\frac{n}{2})} \ &= \frac{0.5^n \cdot 2 \cdot \pi^{n/2}}{n \cdot \frac{2 \frac{n}{2}!}{n}} \ &= \frac{0.5^n \cdot \pi^{n/2}}{\frac{n}{2}!} \end{align} $$
You can see that this term goes to 0 with increasing dimension. This means most of the volume is not in the center, but in the edges of the $n$ dimensional hypercube. It also means that $k$ nearest neighbors with Euclidean Distance measure will need enormously large spheres to get to the next neighbours.
Average angle
One interesting question is how the average angle between two points (and the origin) changes with higher dimensions. Suppose all points are in the $[-1, 1]^n$ hypercube.
I thought about this for a while and came to the conclusion that it should be 90° in average due to symmetry. No matter how high the dimension is.
A short experiment confirms that:
#!/usr/bin/env python

from scipy import spatial
import numpy as np
import seaborn as sns


def cosine_dist(p1, p2):
    """
    Calculate the cosine distance between to points in R^n.

    Examples
    --------
    >>> cosine_dist([1, 0], [0, 1])
    90.0
    >>> cosine_dist([1, 0], [2, 0])
    0.0
    >>> cosine_dist([1, 0], [-1, 0])
    180.0
    """
    ang = 1 - spatial.distance.cosine(p1, p2)
    if not (-1 <= ang <= 1):
        if ang >= 1:
            return 0
        if ang <= -1:
            return 180
    return np.degrees(np.arccos(ang))


def get_angles(n, num_points=100):
    """Get angles of random points in n-dimensional unit hypercube."""
    points = 2 * np.random.rand(num_points, n) - 1
    angles = []
    for p1 in points:
        for p2 in points:
            angles.append(cosine_dist(p1, p2))
    return angles


if __name__ == "__main__":
    import doctest

    doctest.testmod()
    for n in [1, 2, 3, 4, 5, 6, 7, 8, 9, 10, 100, 1000, 10000]:
        angles = get_angles(n)
        print("{:>5} dim: {:0.4f} avg angle".format(n, sum(angles) / len(angles)))
        sns.distplot(angles, kde=False, rug=False)
        sns.plt.show()
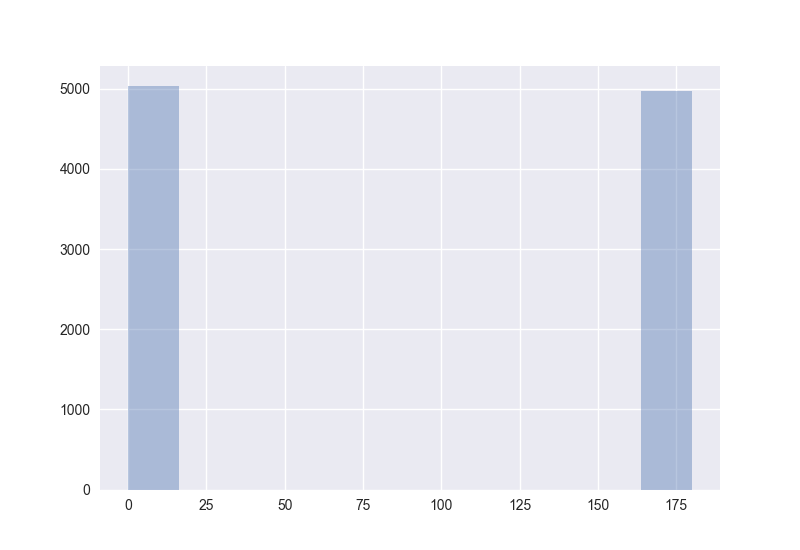
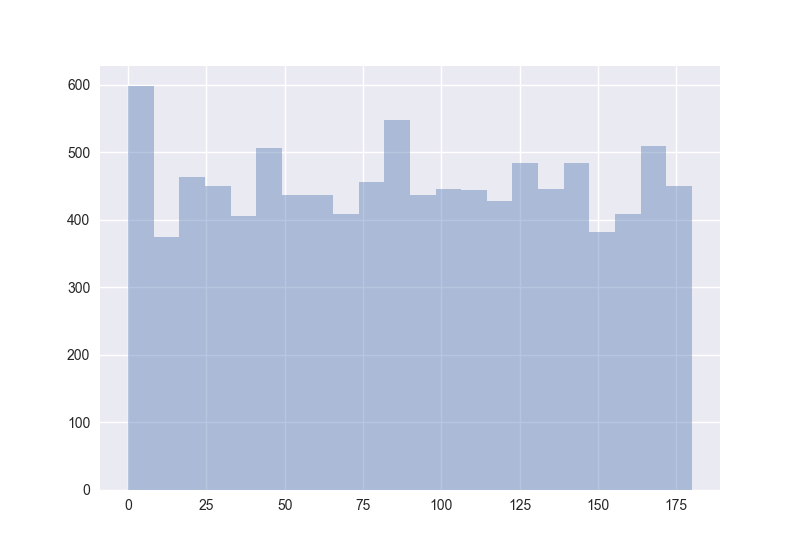
Also interesting: How does the distribution of angles change?
The plots generated by the code from above:
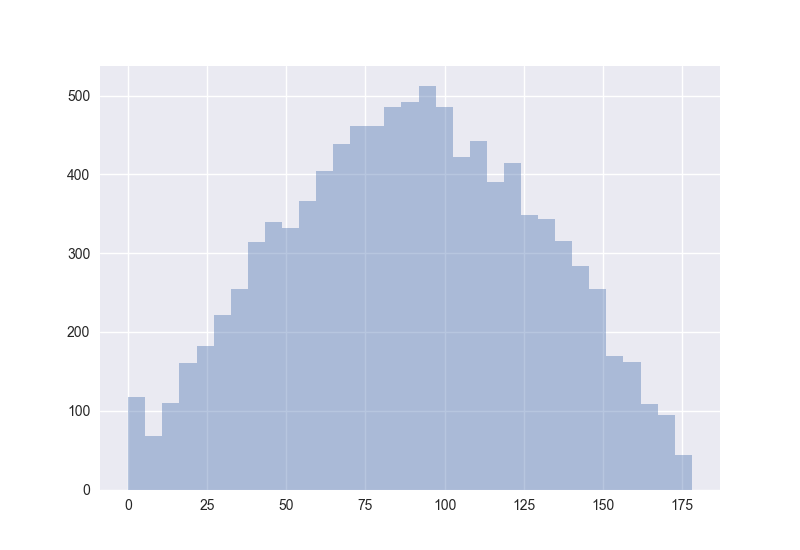
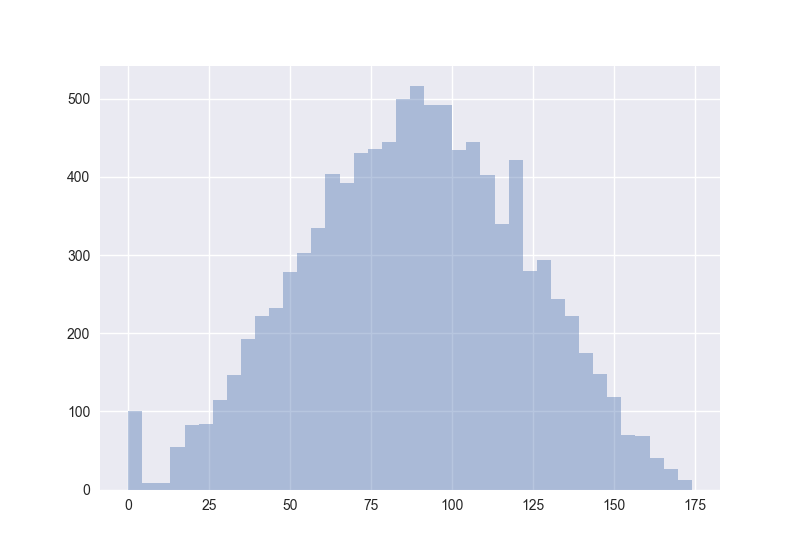
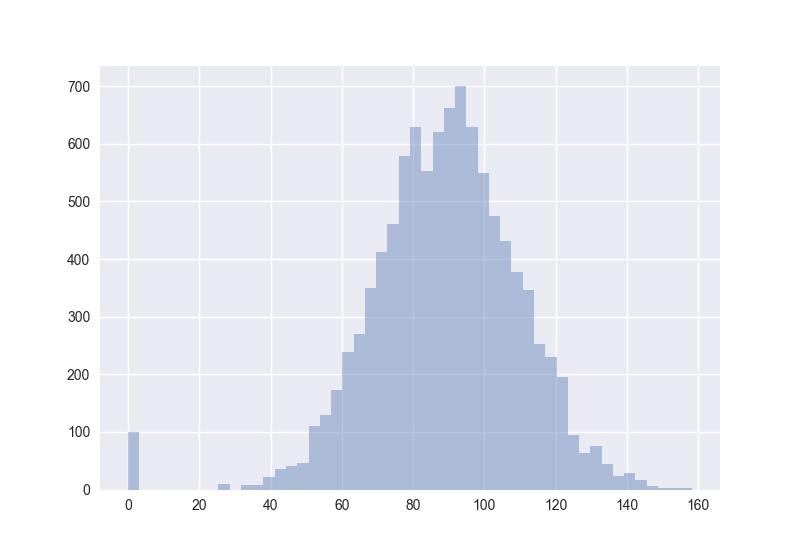
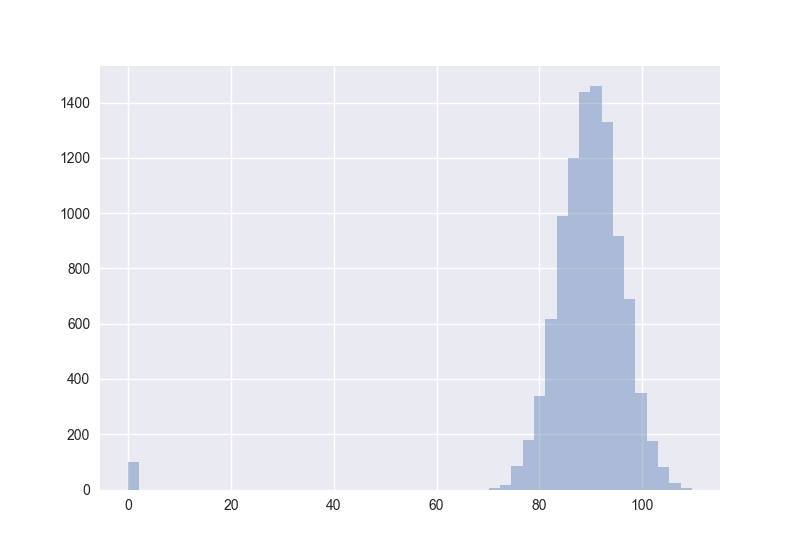
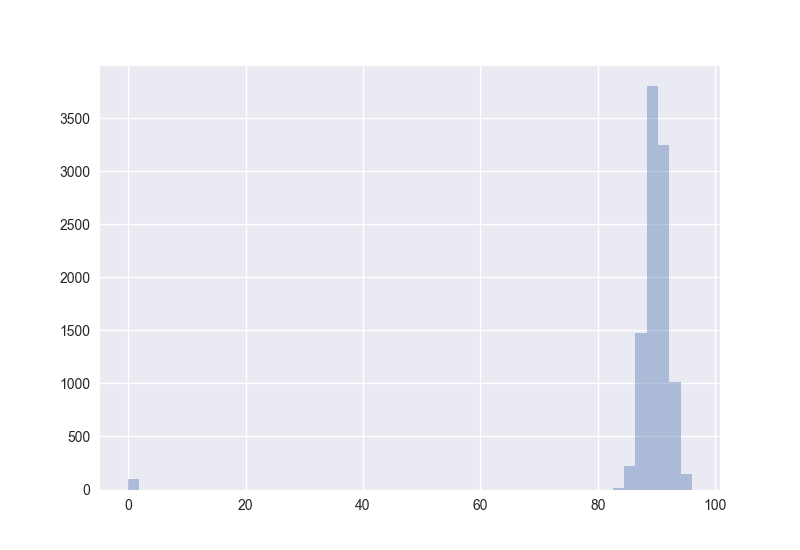
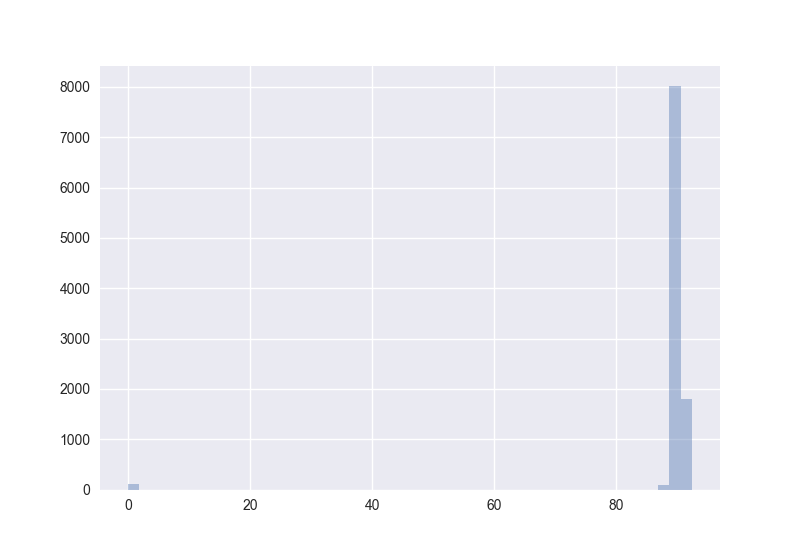
Hence I guess the cosine distance is not a good measure in high-dimensional spaces. (One should measure this for non-random points to get more certain about it.)
Empirical results
#!/usr/bin/env python

"""
Get the empirical statements about the distance of two points in [0, 1]^n.

The points are uniformly randomly sampled.
"""

import numpy.random


def random_points_dist(n):
    """Get the distance of one sample of 2 points in [0, 1]^n."""
    assert n >= 1
    points = []
    for _ in range(2):
        p = numpy.random.rand(n)
        points.append(p)
    return numpy.linalg.norm(points[0] - points[1])


def beta(n):
    """Calculate the average distance of 2 points in [0, 1]^n."""
    sum_ = 0.0
    count_ = 10 ** 6
    less_one = 0
    max_d = 0
    for _ in range(count_):
        dist = random_points_dist(n)
        if dist < 1.0:
            less_one += 1
        max_d = max(max_d, dist)
        sum_ += dist
    return (sum_ / count_, float(less_one) / count_, max_d)


for n in [1, 2, 3, 4, 5, 6, 7, 8, 9, 10, 100, 1000]:
    avg_dist, pr, max_d = beta(n)
    tmp = "beta(n=%i) = %0.4f; " % (n, avg_dist)
    print("%s Pr(d(p1, p2) < 1) = %0.4f; alpha(n=%i, 2) = %0.4f" % (tmp, pr, n, max_d))
One can easily see that points get spaced much farer away in average the higher the dimension $n$ is. Now lets try to calculate the probability that two points in the unit hypercube have a distance of less than 1.
Here are a couple of results. Just a short reminder:
- $\alpha(n, 2)$ is the maximum distance two points can have in a unit cube in $\mathbb{R}^n$
- $\alpha'(n, 2)$ is the maximum observed distance of two points, when all dimensions are independently sampled $10^6$ times.
- $\beta(n)$ is the average distance of two points in $\mathbb{R}^n$
- $Pr(d(p_1, p_2) < 1)$ is the probability, that two uniformly randomly placed points have a distance of less than 1 in $\mathbb{R}^n$
- $V_S(0.5)/V_C(1)$ is the amount a unit ball can fill a unit cube
| $n$ | $\alpha(n, 2)$ | $\alpha'(n, 2)$ | $\beta(n)$ | $Pr(d(p_1, p_2) < 1)$ | $V_S(0.5)/V_C(1)$ |
|---|---|---|---|---|---|
| 1 | 1.0000 | 0.9994 | 0.3332 | 1.0000 | 1 |
| 2 | 1.4142 | 1.3797 | 0.5211 | 0.9749 | 0.7854 |
| 3 | 1.7321 | 1.6116 | 0.6616 | 0.9100 | 0.5236 |
| 4 | 2.0000 | 1.8130 | 0.7776 | 0.8066 | 0.3084 |
| 5 | 2.2361 | 1.8645 | 0.8786 | 0.6787 | 0.1645 |
| 6 | 2.4495 | 1.9659 | 0.9693 | 0.5419 | 0.0807 |
| 7 | 2.6458 | 2.0891 | 1.0515 | 0.4125 | 0.0369 |
| 8 | 2.8284 | 2.1513 | 1.1280 | 0.3006 | 0.0159 |
| 9 | 3.0000 | 2.2888 | 1.2002 | 0.2096 | 0.0064 |
| 10 | 3.1623 | 2.3327 | 1.2671 | 0.1411 | 0.0025 |
| 100 | 10.000 | 5.2152 | 4.0753 | 0.0000 | $\approx 10^{-70}$ |
| 1000 | 31.6228 | 14.0719 | 12.9073 | 0.0000 | $\approx 10^{-1187}$ |
| 10000 | 100.000 | 41.9675 | 40.8245 | 0.0000 | $\approx 10^{-16851}$ |
| $n$ | $\sqrt{n}$ | ? | $\approx 0.41 \cdot \sqrt{n}$ | ? | $\frac{0.5^n \cdot \pi^{n/2}}{\frac{n}{2}!}$ |
You can easily see that the average distance of two points gets less and less different from the observed maximal distance of two points.