I just wanted to solve an exercise where I had random variables \(X_1, \dots, X_n\) which were all \(U([0, 1])\) distributed and \(Y_n = \max(X_1, \dots, X_n)\).
I wondered what the distribution of \(Y_n\) is (for big \(n\)), so I wanted to plot it. How do I plot it? With Python, of course ☺
Here is the program:
#!/usr/bin/env python

import matplotlib.pyplot as plt
import numpy.random


def main():
    # Generate Data
    n = 10000
    numbers_a = numpy.random.uniform(size=samples)
    numbers_b = numpy.random.uniform(size=samples)
    numbers_c = numpy.random.uniform(size=samples)
    numbers_max = [max(a, b, c) for a, b, c in zip(numbers_a, numbers_b, numbers_c)]

    # Plot data
    plt.hist(numbers_max)
    plt.title("Histogram")
    plt.xlabel("value")
    plt.ylabel("count")
    plt.show()


if __name__ == "__main__":
    main()
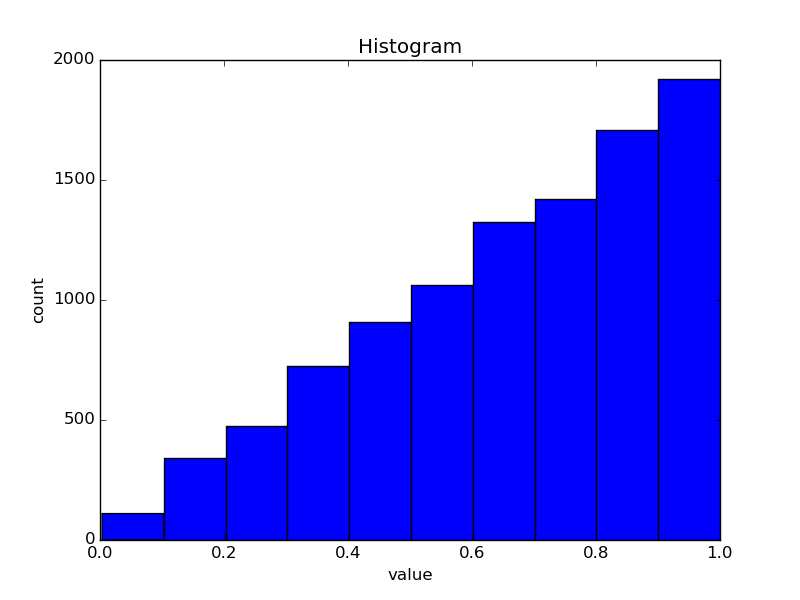
and here is the plot for \(n = 2\)
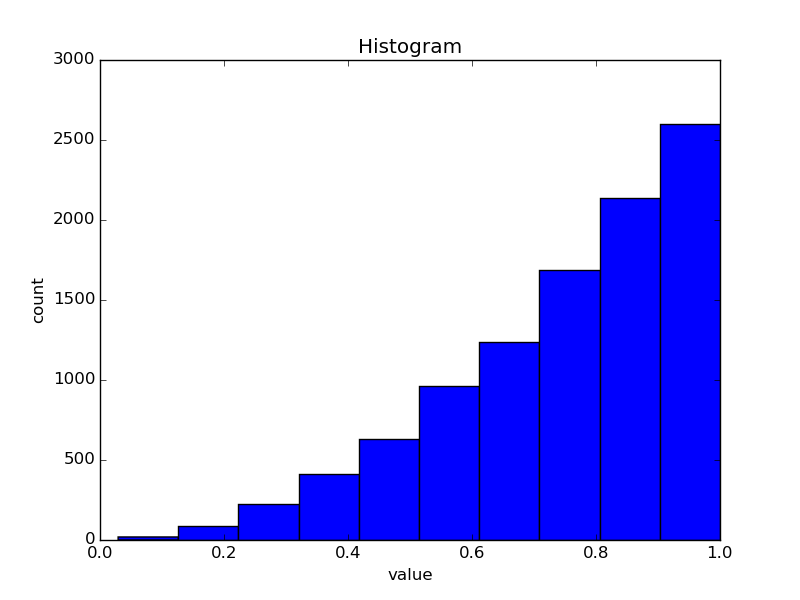
If you increase to \(n = 3\) you get:
Improved version
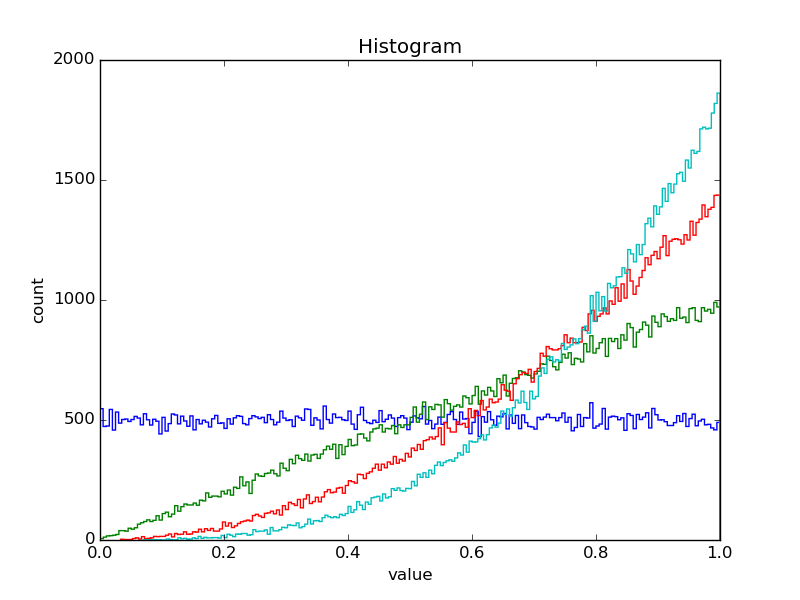
I've also created an improved version which makes nicer plots, but might be harder to read:
#!/usr/bin/env python

import matplotlib.pyplot as plt
import numpy.random


def main(samples, n):
    # Generate Data
    numbers_l = []
    n = n + 1
    for _ in range(n):
        numbers_l.append(numpy.random.uniform(size=samples))

    # Plot data
    plots = []
    for i in range(1, n):
        # Build data structure
        sublist = numbers_l[:i]
        max_list = numbers_l[0]
        for numbers_list in sublist:
            for i, el in enumerate(numbers_list):
                max_list[i] = max(max_list[i], el)
        plot_i = plt.hist(max_list, histtype="step", bins=200)
        plots.append(plot_i)
    plt.title("Histogram")
    plt.xlabel("value")
    plt.ylabel("count")
    plt.show()


def get_parser():
    from argparse import ArgumentParser, ArgumentDefaultsHelpFormatter

    parser = ArgumentParser(
        description=__doc__, formatter_class=ArgumentDefaultsHelpFormatter
    )
    parser.add_argument("-n", dest="n", default=3, type=int, help="n")
    parser.add_argument(
        "-s",
        "--samples",
        dest="samples",
        default=1000,
        type=int,
        help="number of samples per Y_n",
    )
    return parser


if __name__ == "__main__":
    args = get_parser().parse_args()
    main(args.samples, args.n)
When you call this script with
$ ./plot-random-variable.py -n 4 --samples 100000
it gives