Getting insights from data is exciting. So let's see how well I can cover this topic in a single article.
In this article, I assume you have data in a single CSV file. If you have
multiple CSV files, you can merge
them similar to SQL JOIN statements.
Prerequesites
- Python 3
- Pandas (
pip install pandas) - Matplotlib (
pip install matplotlib) - Seaborn (
pip install seaborn)
Loading the data
I load the data as a Pandas Dataframe first. I name this dataframe df.
If the CSV file is too big for RAM, I use the command line tool head to crop
the data. Dask is another option, but I
never actually used it.
I use the titanic training data as an example:
#!/usr/bin/env python3
# -*- coding: utf-8 -*-

import pandas as pd

df = pd.read_csv("train.csv")
How many datapoints do we have?
print("Total number of datapoints: {datapoints}".format(datapoints=len(df)))
shows we have 891 data points in total. Not too much.
Which columns do we have?
print(df.describe())
reveals
       PassengerId    Survived      Pclass         Age       SibSp  \
count   891.000000  891.000000  891.000000  714.000000  891.000000
mean    446.000000    0.383838    2.308642   29.699118    0.523008
std     257.353842    0.486592    0.836071   14.526497    1.102743
min       1.000000    0.000000    1.000000    0.420000    0.000000
25%     223.500000    0.000000    2.000000         NaN    0.000000
50%     446.000000    0.000000    3.000000         NaN    0.000000
75%     668.500000    1.000000    3.000000         NaN    1.000000
max     891.000000    1.000000    3.000000   80.000000    8.000000

            Parch        Fare
count  891.000000  891.000000
mean     0.381594   32.204208
std      0.806057   49.693429
min      0.000000    0.000000
25%      0.000000    7.910400
50%      0.000000   14.454200
75%      0.000000   31.000000
max      6.000000  512.329200
Ok, so we have:
PassengerId: 891 non-nan values. Just an identifier.Survived: 891 non-nan values. I guess only true / false?Pclass: 891 non-nan values. Min=1 and max=3, I guess of type int and thus three classes of passengers?Age: only 714 non-nan values. 0.42 is a weird value ... something like 5 months. And a maximum of 80. So likely in years.- SibSp: According to Kaggle docs: '# of siblings / spouses aboard the Titanic'
- Parch: According to Kaggle docs: '# of parents / children aboard the Titanic'
- Fare: Not sure which unit would make sense here.
Pandas df.describe() is not powerfull enough. So I wrote my own:
#!/usr/bin/env python3
# -*- coding: utf-8 -*-

"""Exploratory data analysis."""

# core modules
import logging
import sys

# 3rd party module
import pandas as pd


logging.basicConfig(
    format="%(asctime)s %(levelname)s %(message)s",
    level=logging.DEBUG,
    stream=sys.stdout,
)


def main(csv_filepath):
    """Exploratory data analysis for the Titanic dataset."""
    # Read data
    dtype = {
        "PassengerId": "str",
        "Embarked": "category",
        "Survived": "category",
        "Pclass": "category",
        "Sex": "category",
        "SibSp": "uint8",
        "Parch": "uint8",
    }
    df = pd.read_csv(csv_filepath, dtype=dtype)
    describe_pandas_df(df, dtype=dtype)


def describe_pandas_df(df, dtype=None):
    """
    Show basic information about a pandas dataframe.

    Parameters
    ----------
    df : Pandas Dataframe object
    dtype : dict
        Maps column names to types
    """
    if dtype is None:
        dtype = {}
    print("Number of datapoints: {datapoints}".format(datapoints=len(df)))
    column_info = {"int": [], "float": [], "category": [], "other": []}
    float_types = ["float64"]
    integer_types = ["int64", "uint8"]
    other_types = ["object", "category"]
    column_info_meta = {}
    for column_name in df:
        column_info_meta[column_name] = {}
        counter_obj = df[column_name].groupby(df[column_name]).count()
        value_list = list(counter_obj.keys())
        value_count = len(value_list)
        is_suspicious_cat = (
            value_count <= 50
            and str(df[column_name].dtype) != "category"
            and column_name not in dtype
        )
        if is_suspicious_cat:
            logging.warning(
                "Column '{}' has only {} different values ({}). "
                "You might want to make it a 'category'".format(
                    column_name, value_count, value_list
                )
            )
        top_count_val = counter_obj[value_list[0]]
        column_info_meta[column_name]["top_count_val"] = top_count_val
        column_info_meta[column_name]["value_list"] = value_list
        column_info_meta[column_name]["value_count"] = value_count
        if df[column_name].dtype in integer_types:
            column_info["int"].append(column_name)
        elif df[column_name].dtype in float_types:
            column_info["float"].append(column_name)
        elif str(df[column_name].dtype) == "category":
            column_info["category"].append(column_name)
        elif df[column_name].dtype in other_types:
            column_info["other"].append(column_name)
        else:
            print(
                "!!! describe_pandas_df does not know type '{}'".format(
                    df[column_name].dtype
                )
            )

    column_name_len = max(len(column_name) for column_name in df)

    print("\n## Integer Columns")
    print(
        "{column_name:<{column_name_len}}: Non-nan  mean   std   min   25%  "
        " 50%   75%   max".format(
            column_name_len=column_name_len, column_name="Column name"
        )
    )
    for column_name in column_info["int"]:
        print(
            "{column_name:<{column_name_len}}: {non_nan:>7}  "
            "{mean:0.2f}  {std:>4.2f}  "
            "{min:>4.0f}  {q25:>4.0f}  {q50:>4.0f}  {q75:>4.0f}  {max:>4.0f}".format(
                column_name_len=column_name_len,
                column_name=column_name,
                non_nan=sum(df[column_name].notnull()),
                mean=df[column_name].mean(),
                std=df[column_name].std(),
                min=df[column_name].min(),
                q25=df[column_name].quantile(0.25),
                q50=df[column_name].quantile(0.50),
                q75=df[column_name].quantile(0.75),
                max=max(df[column_name]),
            )
        )

    print("\n## Float Columns")
    print(
        "{column_name:<{column_name_len}}: Non-nan   mean    std    min    "
        "25%    50%    75%    max".format(
            column_name_len=column_name_len, column_name="Column name"
        )
    )
    for column_name in column_info["float"]:
        print(
            "{column_name:<{column_name_len}}: {non_nan:>7}  "
            "{mean:5.2f}  {std:>4.2f}  "
            "{min:>5.2f}  {q25:>5.2f}  {q50:>5.2f}  {q75:>5.2f}  {max:>5.2f}".format(
                column_name_len=column_name_len,
                column_name=column_name,
                non_nan=sum(df[column_name].notnull()),
                mean=df[column_name].mean(),
                std=df[column_name].std(),
                min=df[column_name].min(),
                q25=df[column_name].quantile(0.25),
                q50=df[column_name].quantile(0.50),
                q75=df[column_name].quantile(0.75),
                max=max(df[column_name]),
            )
        )
    print("\n## Category Columns")
    print(
        "{column_name:<{column_name_len}}: Non-nan   unique   top (count)  "
        "rest".format(column_name_len=column_name_len, column_name="Column name")
    )
    for column_name in column_info["category"]:
        # print(df[column_name].describe())
        rest_str = str(column_info_meta[column_name]["value_list"][1:])[:40]
        print(
            "{column_name:<{column_name_len}}: {non_nan:>7}   {unique:>6}   "
            "{top} ({count})  {rest}".format(
                column_name_len=column_name_len,
                column_name=column_name,
                non_nan=sum(df[column_name].notnull()),
                unique=len(df[column_name].unique()),
                top=column_info_meta[column_name]["value_list"][0],
                count=column_info_meta[column_name]["top_count_val"],
                rest=rest_str,
            )
        )

    print("\n## Other Columns")
    print(
        "{column_name:<{column_name_len}}: Non-nan   unique   top (count)".format(
            column_name_len=column_name_len, column_name="Column name"
        )
    )
    for column_name in column_info["other"]:
        rest_str = str(column_info_meta[column_name]["value_list"][1:])[:40]
        print(
            "{column_name:<{column_name_len}}: {non_nan:>7}   {unique:>6}   "
            "{top} ({count})".format(
                column_name_len=column_name_len,
                column_name=column_name,
                non_nan=sum(df[column_name].notnull()),
                unique=len(df[column_name].unique()),
                top=column_info_meta[column_name]["value_list"][0],
                count=column_info_meta[column_name]["top_count_val"],
            )
        )


def get_parser():
    """Get parser object for exploratory data analysis."""
    from argparse import ArgumentParser, ArgumentDefaultsHelpFormatter

    parser = ArgumentParser(
        description=__doc__, formatter_class=ArgumentDefaultsHelpFormatter
    )
    parser.add_argument(
        "-f",
        "--file",
        dest="filename",
        help="read this csv file",
        metavar="FILE",
        required=True,
    )
    return parser


if __name__ == "__main__":
    args = get_parser().parse_args()
    main(args.filename)
which gives:
Number of datapoints: 891

## Integer Columns
Column name: Non-nan  mean   std   min   25%   50%   75%   max
SibSp      :     891  0.52  1.10     0     0     0     1     8
Parch      :     891  0.38  0.81     0     0     0     0     6

## Float Columns
Column name: Non-nan   mean    std    min    25%    50%    75%    max
Age        :     714  29.70  14.53   0.42  20.12  28.00  38.00  80.00
Fare       :     891  32.20  49.69   0.00   7.91  14.45  31.00  512.33

## Category Columns
Column name: Non-nan   unique   top (count)  rest
Survived   :     891        2   0 (549)  ['1']
Pclass     :     891        3   1 (216)  ['2', '3']
Sex        :     891        2   female (314)  ['male']
Embarked   :     889        4   C (168)  ['Q', 'S']

## Other Columns
Column name: Non-nan   unique   top (count)
PassengerId:     891      891   1 (1)
Name       :     891      891   Abbing, Mr. Anthony (1)
Ticket     :     891      681   110152 (3)
Cabin      :     204      148   A10 (1)
This is much more useful. In the process, I created a dictionary dtypes which
tells pandas as which type it should load the columns.
Also interesting:
df.groupby(df["foo"]).count()
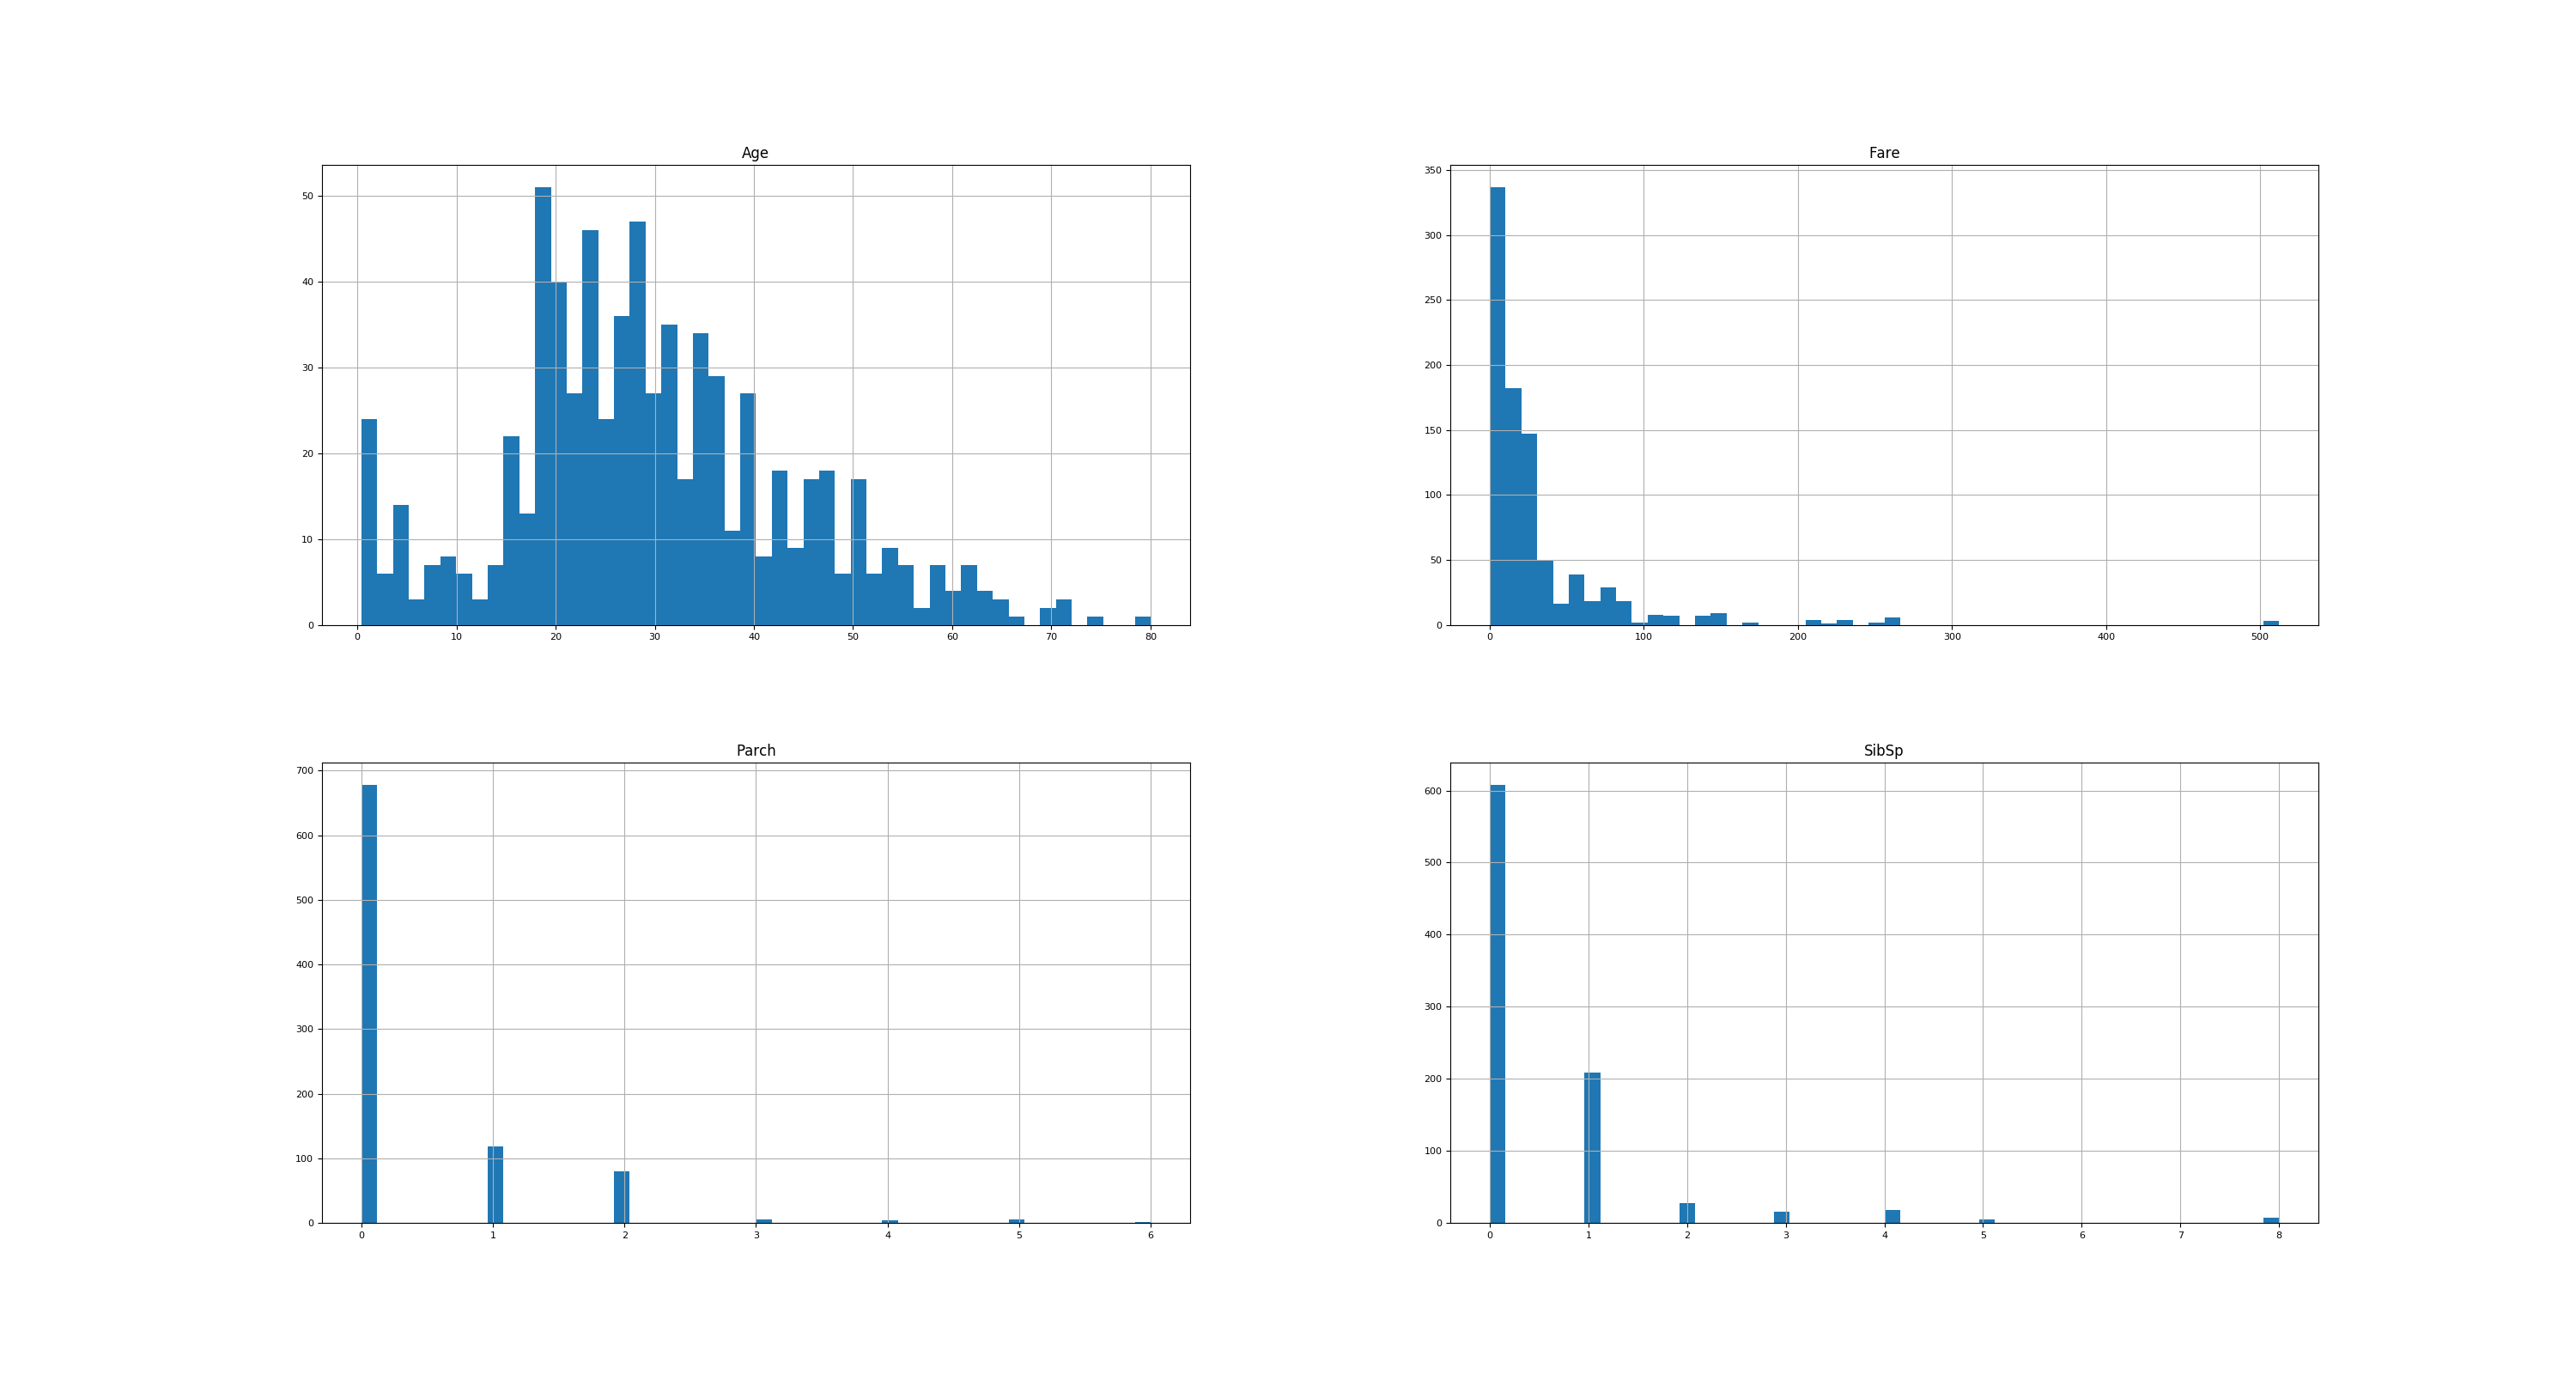
Show single-feature distribution
# Show histograms
numeric_types = ["float64", "int64", "uint8"]
numerical_features = df.select_dtypes(include=numeric_types)
numerical_features.hist(figsize=(30, 16), bins=50, xlabelsize=8, ylabelsize=8)
plt.savefig("titanic-histograms.png")
plt.show()
gives
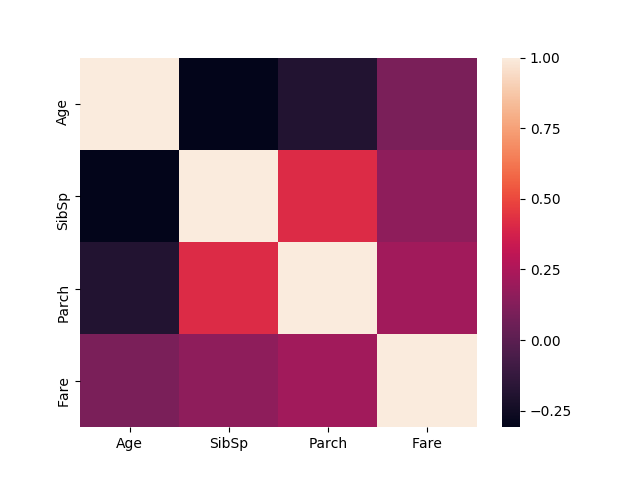
Find correlations
# Show correlations
import seaborn as sns

corr = numerical_features.corr()
sns.heatmap(corr)
plt.savefig("titanic-correlation.png")
plt.show()
gives
Joint plots
See also
- Chloe Mawer, Jonathan Whitmore - Exploratory data analysis in python - PyCon 2017