Finite-state machines are necessary to show that some problems are computable (or not).
As I am currently learning something about them, I would like to be able to plot those finite automatons automatically. I will use graphviz.
Nondeterministic finite-state machine

This image is created from a gv-file. I saved it as fsm.gv:
digraph finite_state_machine {
    rankdir=LR;
    size="8,5"

    node [shape = doublecircle]; S;
    node [shape = point ]; qi

    node [shape = circle];
    qi -> S;
    S  -> q1 [ label = "a" ];
    S  -> S  [ label = "a" ];
    q1 -> S  [ label = "a" ];
    q1 -> q2 [ label = "b" ];
    q2 -> q1 [ label = "b" ];
    q2 -> q2 [ label = "b" ];
}
To create a graph (or the picture of the nondeterministic finite-state machine) you have to enter the following command in Ubuntu Linux:
dot -Tpng fsm.gv -o myFiniteStateMachine.png
Deterministic Finite-State Machine

digraph finite_state_machine {
    rankdir=LR;
    size="8,5"

    node [shape = doublecircle, label="{f}", fontsize=12] f;
    node [shape = doublecircle, label="{q2, f}", fontsize=10] q2f;

    node [shape = circle, label="S", fontsize=14] S;
    node [shape = circle, label="{q1}", fontsize=12] q1;
    node [shape = circle, label="{q2}", fontsize=12] q2;

    node [shape = point ]; qi
    qi -> S;

    S   -> q1  [ label = "a" ];
    S   -> q2f [ label = "b" ];
    S   -> q2  [ label = "c" ];

    q1  -> q2  [ label = "b" ];

    q2f -> f   [ label = "b" ];
    q2f -> q2  [ label = "c" ];

    q2  -> f   [ label = "b" ];
    q2  -> q2  [ label = "c" ];
}
LaTeX
If you want to draw finite-state machines with LaTeX, you might want to give tikz a try.
This is the most minimalistic version I could create. It is equivalent to the nondeterministic finite-state machine I've described above:
\documentclass{scrartcl}
\usepackage{tikz}
\usetikzlibrary{arrows,automata}

\begin{document}
\begin{tikzpicture}[>=stealth',shorten >=1pt,auto,node distance=2cm]
  \node[initial,state,accepting] (S)      {$S$};
  \node[state]         (q1) [right of=S]  {$q_1$};
  \node[state]         (q2) [right of=q1] {$q_2$};


  \path[->] (S)  edge [loop above] node {a} (S)
             edge              node {a} (q1)
        (q1) edge [bend left]  node {a} (S)
             edge              node {b} (q2)
        (q2) edge [loop above] node {b} (q2)
             edge [bend left]  node {b} (q1);
\end{tikzpicture}
\end{document}
This was the most basic example which shows how to draw a finite-state automaton with LaTeX. You can get it as a PDF with this command:
pdflatex latexsheet.tex -output-format=pdf
If you want to see some more fancy stuff, take a look at this example of a non-deterministic finite state machine:
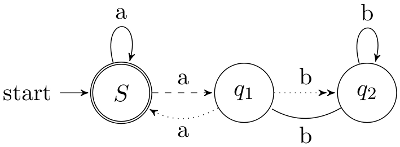
\documentclass{scrartcl}
\usepackage{tikz}
\usetikzlibrary{arrows,automata}

\begin{document}
\begin{tikzpicture}[>=stealth',shorten >=1pt,auto,node distance=2cm]
  \node[initial,state,accepting] (S)      {$S$};
  \node[state]         (q1) [right of=S]  {$q_1$};
  \node[state]         (q2) [right of=q1] {$q_2$};

  \path[->]          (S)  edge [loop above] node {a} (S);
  \path[->, dashed]  (S)  edge              node {a} (q1);
  \path[->, dotted]  (q1) edge [bend left]  node {a} (S);
  \path[->>, dotted] (q1) edge             node {b} (q2);
  \path              (q2) edge [loop above] node {b} (q2)
             edge [bend left]  node {b} (q1);
\end{tikzpicture}
\end{document}
Markov Models
\documentclass{scrartcl}
\usepackage{tikz}
\usetikzlibrary{arrows,automata}

\begin{document}
\begin{tikzpicture}[->,>=stealth',shorten >=1pt,node distance=2.8cm]
    % When you want to use // inside of nodes, you have to algin
    \tikzstyle{every state}=[align=center]
    \node[state,initial,label=below:Start] (Start)
                                            {A 0.6\\B 0.2\\C 0.2};
    \node[state,label=below:Mitte] (Mitte) [right of=Start]
                                            {A 0.1\\B 0.1\\C 0.8};
    \node[state,label=below:Ende] (Ende)   [right of=Mitte]
                                            {A 0.5\\B 0.2\\C 0.3};
    \path (Start) edge               node[above] {0.2} (Mitte);
    \path (Mitte) edge               node[above] {0.8} (Ende);
    \path (Start) edge  [loop above] node        {0.8} (Start);
    \path (Mitte) edge  [loop above] node        {0.2} (Mitte);
    \path (Ende)  edge  [loop above] node        {1}  (Ende);
\end{tikzpicture}
\end{document}
Further Reading
- DOT Node Shape reference
- ubuntuusers.de (German): Installation on Ubuntu
- Wikischool.de (German): Many examples