If you have a working program and you want to improve its execution speed, you might want to profile it. An easy way to do so, is adding global variables, increasing them at interesting points and counting how often these points are executed. A more sophisticated way is using a profiler.
valgrind and kcachegrind
Install valgrind and kcachegrind. For Ubuntu users:
sudo apt-get install valgrind kcachegrind
Create a profile:
valgrind --tool=callgrind ./connectfour
(I've profiled a connect four application. Replace that with your application) This command will create a file called similar to "callgrind.out.4846".
Take a look at the profile:
kcachegrind callgrind.out.4846
You can also create a call-graph:
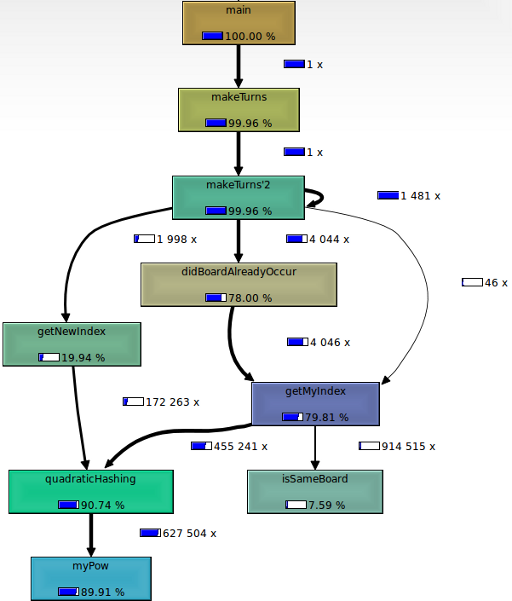
Just take a look at it by yourself. You will see much more than I could tell you now.