Today, I played a bit with the International airline passengers dataset.
It's only feature is a date given by year and month. One should predict the number of passengers (in thousands).
Code
See Github.
Results
See the scoring functions are explained in the regression article.
| name | training time | testing time | MAE | MAD | $R^2$ | explained variance | MSE |
|---|---|---|---|---|---|---|---|
| GradientBoostingRegressor | 11.6ms | 0.1ms | 40.0 | 31.0 | 0.5689 | 0.6246 | 2631.9 |
| GaussianProcessRegressor | 8.4ms | 0.2ms | 150.9 | 85.9 | -8.0324 | -6.7089 | 55138.3 |
| AdaBoostRegressor | 69.3ms | 1.1ms | 60.1 | 53.3 | 0.1240 | 0.5812 | 5347.3 |
| SGDRegressor | 0.8ms | 0.1ms | 106.5 | 84.8 | -1.7081 | 0.1471 | 16531.5 |
| RANSACRegressor | 4.1ms | 0.0ms | 68.5 | 39.4 | -0.4294 | 0.1479 | 8726.0 |
| PassiveAggressiveRegressor | 0.2ms | 0.0ms | 115.8 | 115.5 | -1.8841 | 0.1268 | 17606.2 |
| BaggingRegressor | 13.4ms | 0.9ms | 46.7 | 37.1 | 0.4162 | 0.4912 | 3564.0 |
| HuberRegressor | 8.0ms | 0.0ms | 65.4 | 59.8 | -0.0745 | 0.0395 | 6559.5 |
| RandomForestRegressor | 18.6ms | 5.2ms | 48.3 | 38.5 | 0.4336 | 0.6535 | 3457.7 |
| XGBoost | 5.5ms | 0.1ms | 49.3 | 37.7 | 0.4139 | 0.7215 | 3578.1 |
| ExtraTreesRegressor | 17.2ms | 4.7ms | 44.1 | 33.2 | 0.4744 | 0.5036 | 3208.6 |
| RBF SVR | 2.1ms | 0.3ms | 202.2 | 182.0 | -6.6885 | 0.0105 | 46934.4 |
| Linear SVR + Standardscaler | 1.4ms | 0.2ms | 84.1 | 60.6 | -0.9573 | 0.1338 | 11948.3 |
| LinearRegression | 10.8ms | 0.1ms | 55.9 | 41.9 | 0.1068 | 0.1700 | 5452.5 |
| ElasticNet | 0.3ms | 0.0ms | 56.0 | 41.7 | 0.1069 | 0.1698 | 5452.0 |
| Lasso | 0.4ms | 0.0ms | 56.0 | 41.5 | 0.1069 | 0.1698 | 5451.8 |
I like the median absolute error best, because it tells me how many passengers my prediction is typically away from the true prediction.
Please note that bad results here do not mean the regressor is bad. Some might just use their full potential with more data, some might be better suited to different regression problems, e.g. interpolation instead of extrapolation or working with higher dimensional data.
Graphs
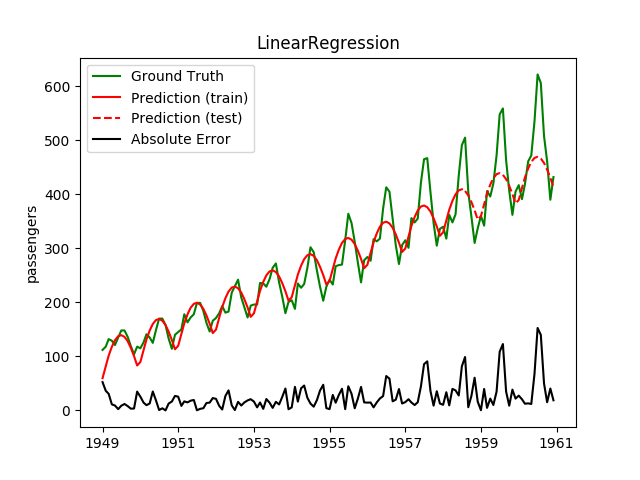
Plotting the prediction is crucial for extrapolation. What we can see in those images is that there are two things to match: A global trend and local seasonality-effects. To make it easier to digest, I already put them in the table. Just click on them to see them in full size:
| Model | Trend | Seasonality | Graph | Comment |
|---|---|---|---|---|
| RBF SVR | ✘ | ✘ | 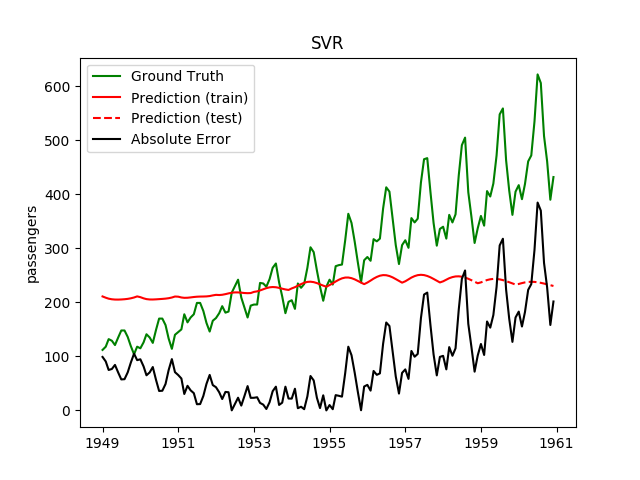 |
Doesn't learn anything useful at all |
| GaussianProcessRegressor | ✘ | Kind of | 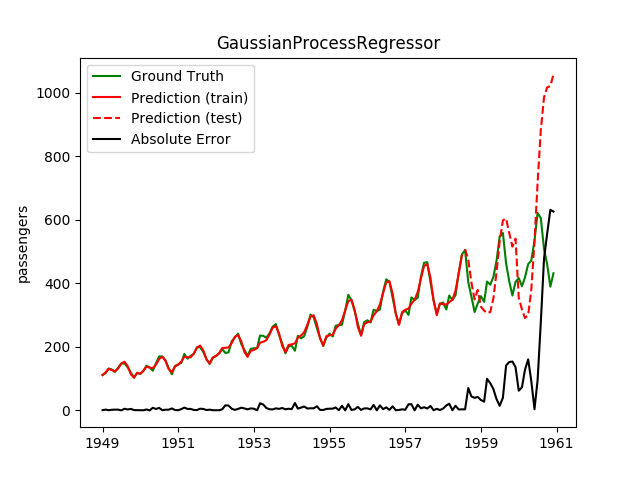 |
Overshoots extremely |
| AdaBoostRegressor | ✘ | ✔ | 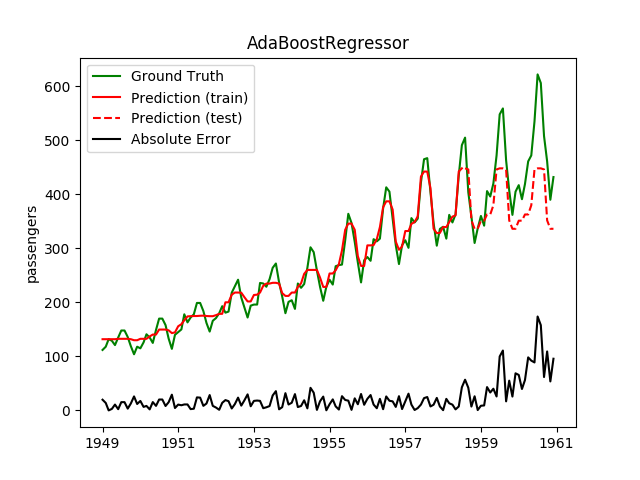 |
|
| BaggingRegressor | ✘ | ✔ | 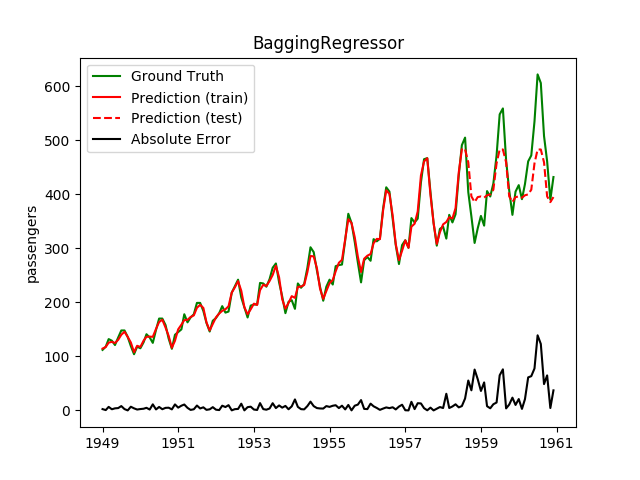 |
|
| XGBoost | ✘ | ✔ | 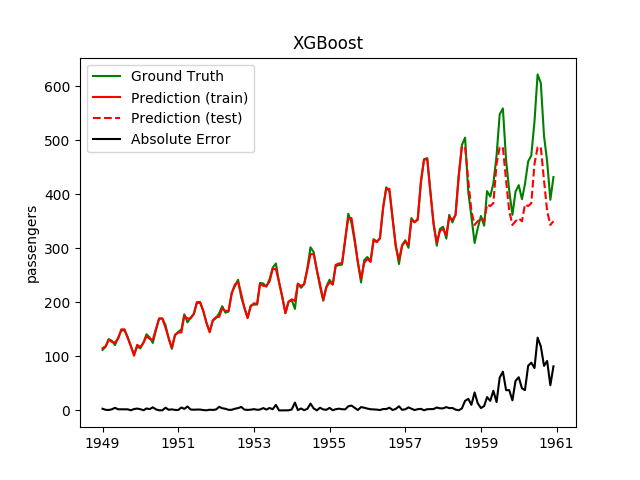 |
|
| ExtraTreesRegressor | ✘ | ✔ | 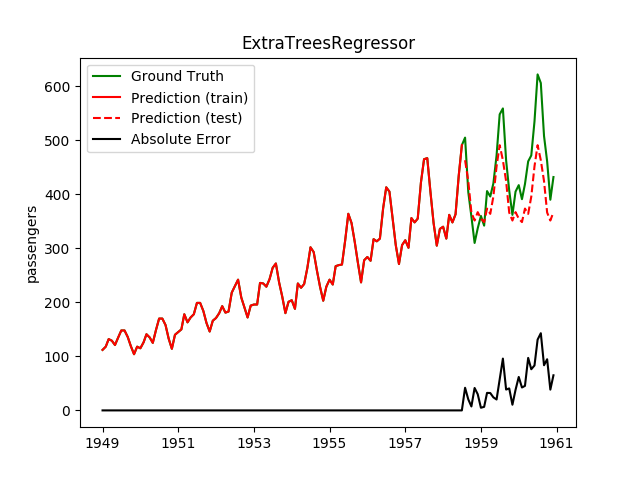 |
Note the extreme overfitting |
| RandomForestRegressor | ✘ | ✔ | 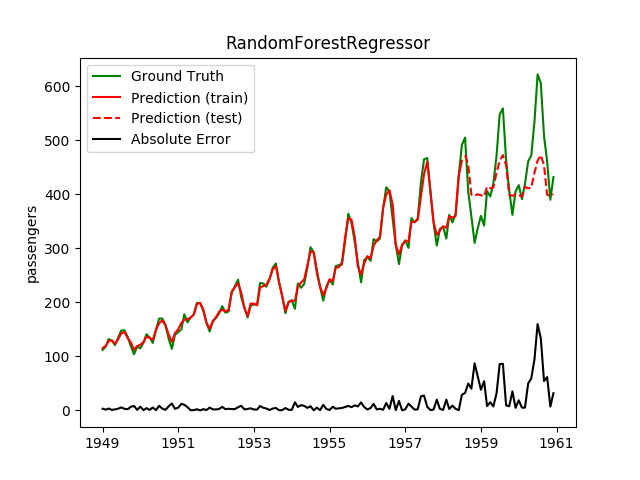 |
|
| GradientBoostingRegressor | ✘ | ✔ | 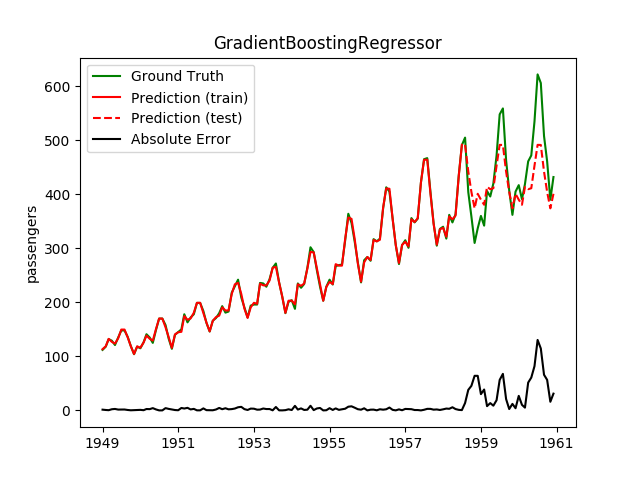 |
|
| Lasso | ✔ | ✘ | 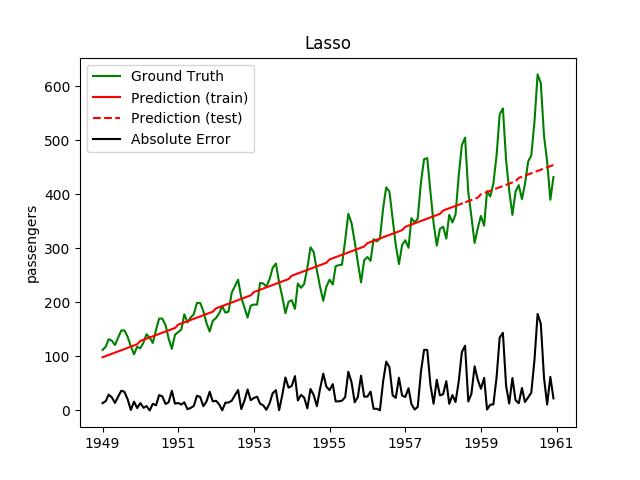 |
|
| Linear SVR | ✔ | ✘ | 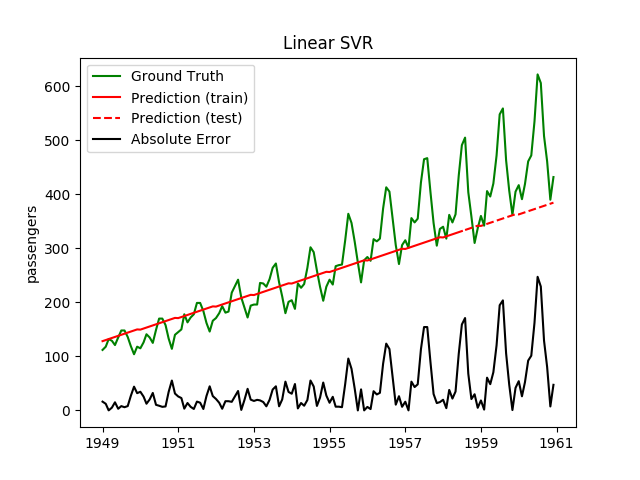 |
|
| RANSACRegressor | ✔ | ✘ |  |
|
| LinearRegression | ✔ | ✘ | 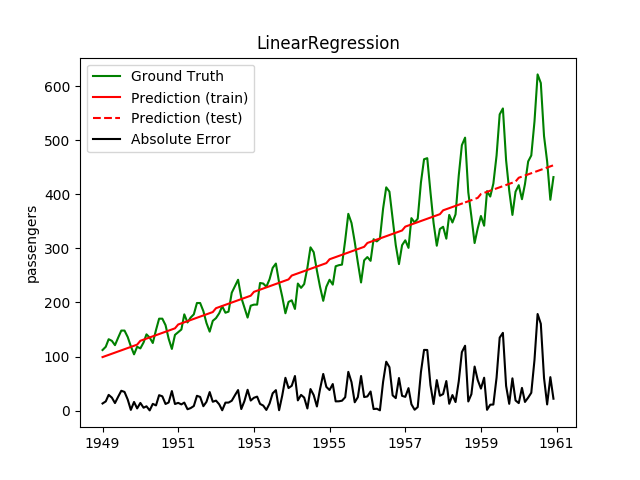 |
|
| ElasticNet | ✔ | ✘ |  |
|
| SGDRegressor | ✔ | ✘ | 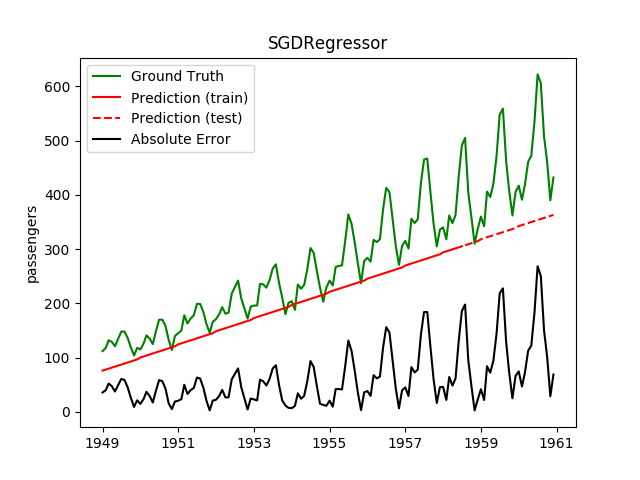
|
|
| HuberRegressor | ✔ | ✔ | 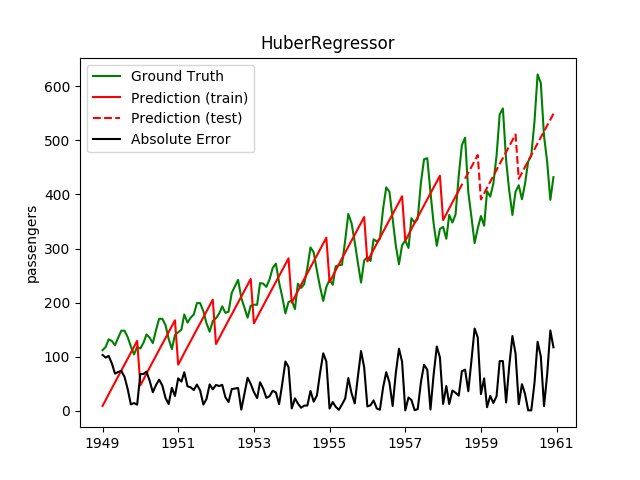 |
Both are captured pretty bad |
| PassiveAggressiveRegressor | ✔ | ✔ | 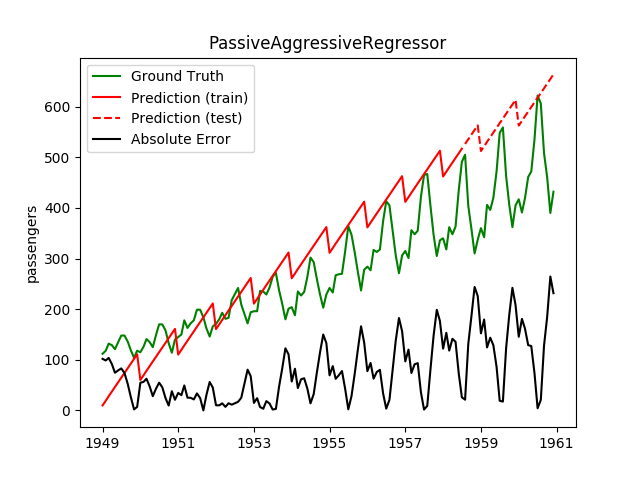 |
Both are captured pretty bad |
Seeing this result, I decided to have two models: One which predicts the trend and one which predicts seasonality effects.
Combining models
The simplest way to combine two regression models is by
$$f(x) = f_1(x) + f_2(x)$$
But I also want to simpify the training. So I decided to have the following training setup:
- Fit $f_1$ on the training dataset, where $f_1$ has to predict the global trend and thus solve the extrapolation problem. Lasso seems to be a good choice.
- Transform the training data $(X, y)$: $$y' = y - f_1(X)$$
- Fit $f_2$ on $(X, y')$. So $f_2$ has to solve an interpolation problem.
I call this model TrendSeasonRegressor. Let's try a few combinations:
| $f_1$ | $f_2$ | MAE | MAD | $R^2$ | explained variance | MSE | Image |
|---|---|---|---|---|---|---|---|
| GradientBoostingRegressor | 40.0 | 31.0 | 0.5689 | 0.6246 | 2631.9 |
|
|
| Linear Regression | ExtraTrees | 19.1 | 14.5 | 0.8958 | 0.9096 | 636.1 | 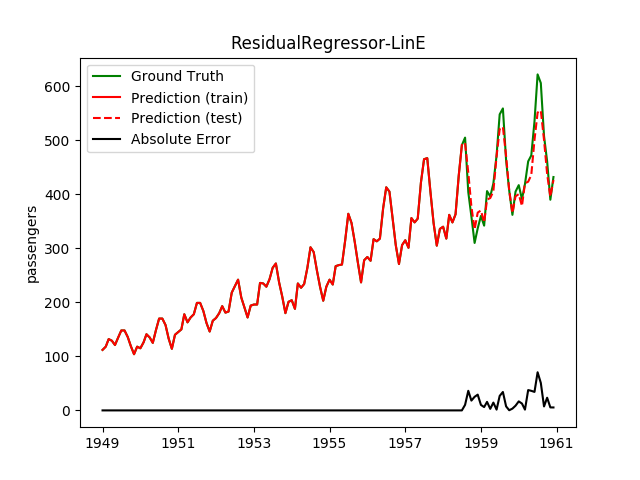
|
| Lasso | ExtraTrees | 20.8 | 16.6 | 0.8803 | 0.8992 | 730.9 | 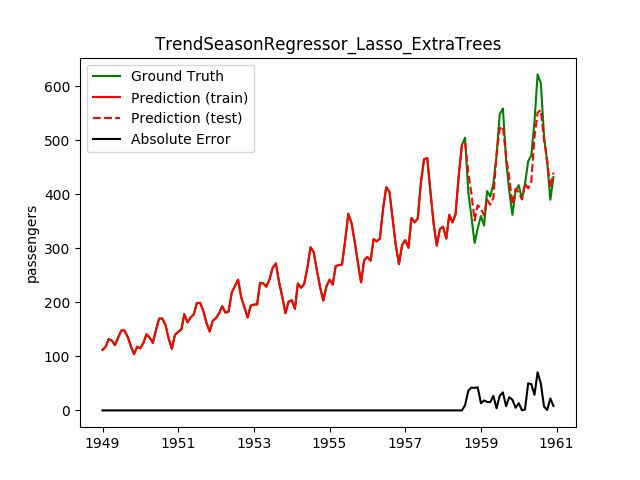
|
| ElasticNet | ExtraTrees | 25.2 | 24.4 | 0.8382 | 0.8403 | 988.0 | 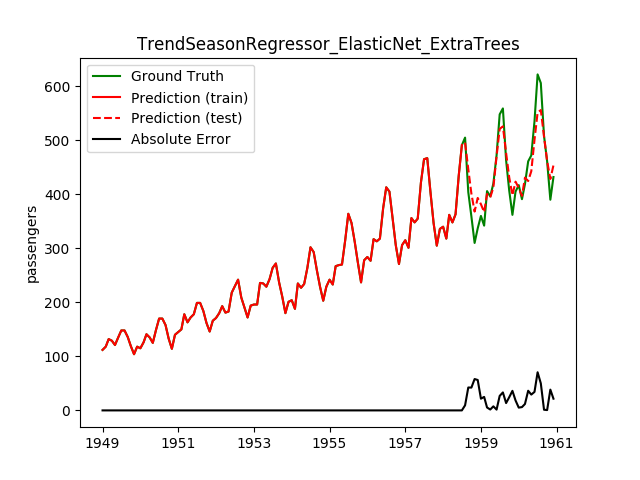
|
| LinearSVR | ExtraTrees | 36.4 | 31.1 | 0.6841 | 0.7081 | 1928.2 | 
|
| LinearSVR | Adaboost | 33.7 | 32.6 | 0.6918 | 0.7849 | 1881.5 | 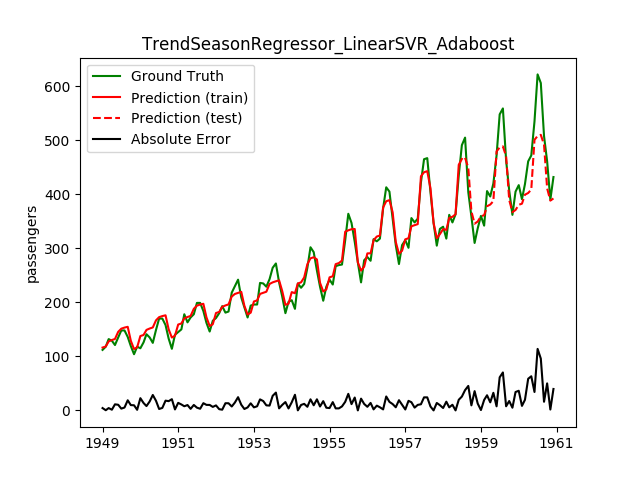
|
| Lasso | Adaboost | 26.5 | 18.9 | 0.8034 | 0.8143 | 1200.4 | 
|
| ElasticNet | Adaboost | 26.5 | 19.4 | 0.8098 | 0.8229 | 1161.2 | 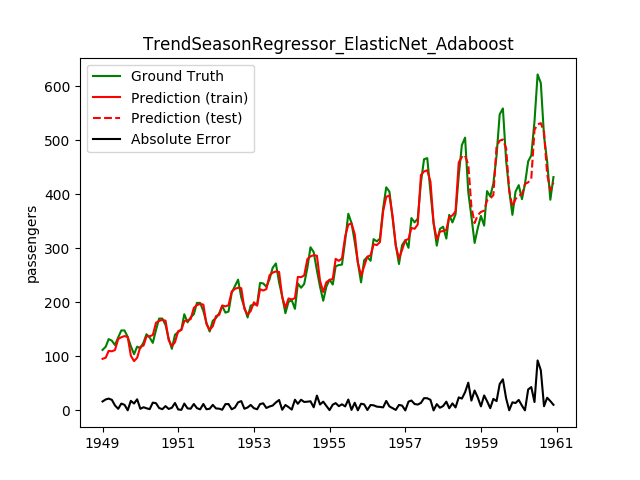
|
This looks a lot better! Note how the best model before is now the worst!
However, even with this combination the Gaussian Processes were really bad. Overshooting like hell.
Next thing to improve: The scaling of the the seasonal trend is not captured so far.
Another idea I want to dig into is that of residual learning. Where I have only
one model learning the residual of another model, you can chain arbitary many.
The ResidualRegressor is a meta-regressor. If it is given one model, it
behaves exactly like that model. If it is given two models, then it behaves
exactly like the TrendSeasonRegressor.
Sadly, for the given data and the models I've tried, three models behaved not
better than two in the ResidualRegressor.
Human Performance
An interesting excercise is to get a human baseline. This gives you some insights in how good the models are.
| Label | Truth | Martin | Person 2 | Person3 |
|---|---|---|---|---|
| 1958-08 | 505 | 490 (+15) | ||
| 1958-09 | 404 | 440 (+36) | ||
| 1958-10 | 359 | 370 (+11) | ||
| 1958-11 | 310 | 340 (+30) | ||
| 1958-12 | 337 | 360 (+23) | ||
| 1959-01 | 360 | 375 (+15) | ||
| 1959-02 | 342 | 365 (+23) | ||
| 1959-03 | 406 | 410 (+4) | ||
| 1959-04 | 396 | 365 (+31) | ||
| 1959-05 | 420 | 410 (+10) | ||
| 1959-06 | 472 | 500 (+28) | ||
| 1959-07 | 548 | 570 (+22) | ||
| 1959-08 | 559 | 570 (+11) | ||
| 1959-09 | 463 | 490 (+27) | ||
| 1959-10 | 407 | 433 (+26) | ||
| 1959-11 | 362 | 375 (+13) | ||
| 1959-12 | 405 | 400 (+5) | ||
| 1960-01 | 417 | 410 (+7) | ||
| 1960-02 | 391 | 395 (+4) | ||
| 1960-03 | 419 | 460 (+41) | ||
| 1960-04 | 461 | 450 (+11) | ||
| 1960-05 | 472 | 510 (+38) | ||
| 1960-06 | 535 | 570 (+35) | ||
| 1960-07 | 622 | 630 (+8) | ||
| 1960-08 | 606 | 630 (+24) | ||
| 1960-09 | 508 | 550 (+42) | ||
| 1960-10 | 461 | 480 (+19) | ||
| 1960-11 | 390 | 410 (+20) | ||
| 1960-12 | 432 | 440 (+8) | ||
| MAE | 0 | 20.24 | ||
| MAD | 0 | 20.0 | ||
| MSE | 0 | 539.8 |
absolute_errors = [15, 36, 11, 30, 23, 15, 23, 4, 31, 10, 28,22,11,27,26,13,5,7,4,41,11,38,35,8,24,42,19,20,8]
Circular Features
Having the month as a single feature with values from 1 to 12 seems not to be
the best choice. Either a one-hot encoding or a circular encoding (two features
with the trigonometric functions sin and cos) seem to be the better choice.
Using the circular encoding was interesting. It made the prediction to get "bumps":
However, both encodings did not yield better results than the simple integer encoding of a month for this dataset and all tried regressors.
TODOs
- Make a hand-crafted model
- Get a human baseline
- Make a neural network model
Learnings
The following should have become clear from reading this blog post:
- L1: SGDRegressor without scaling is crazy bad.
- L2: Without hyperparameter optimization (e.g. twiddling), SVR is shitty.
- L3: Without scaling, linear SVR runs many hours for training. On a dataset with 3 features and less than 150 data points.
- L4: Visualizations are powerful for model evaluation and improvement in low-dimensional regression problems.