Quite a while ago, I had to use R for a statistics class.
Nice things about R
R has a neat programming environment called rstudio:
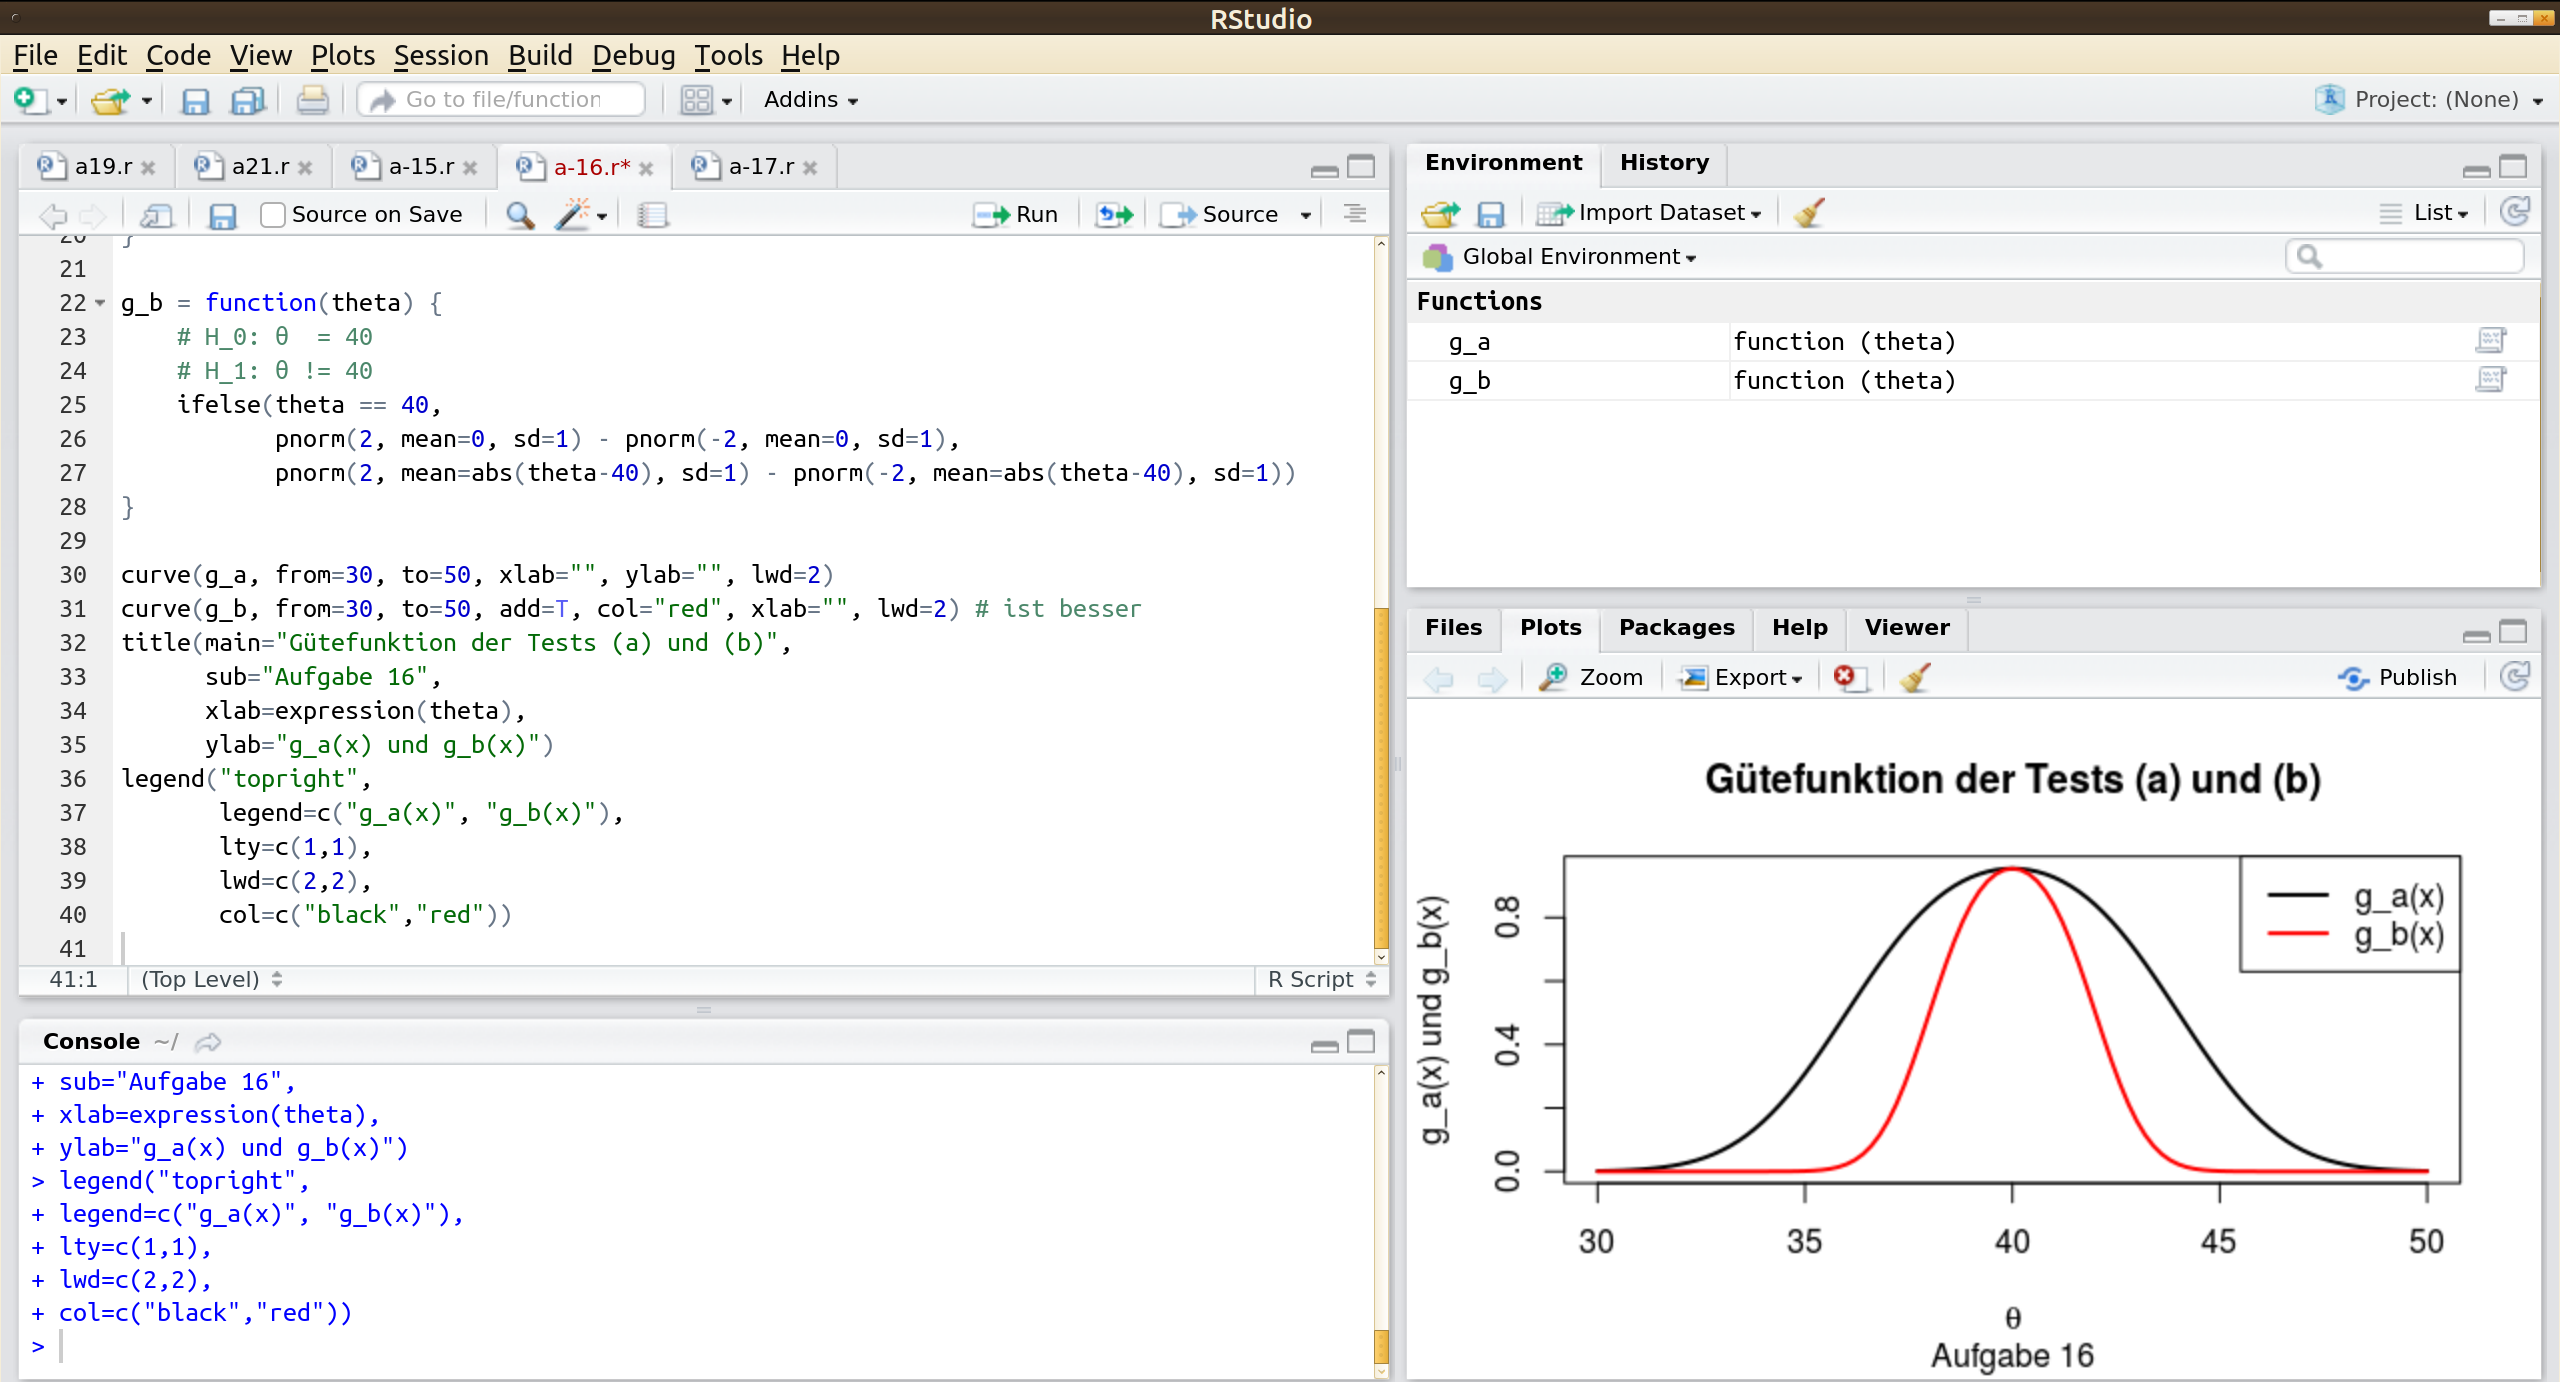
As you can see, RStudio conveniently shows:
- The code,
- an interactive console,
- a window with plots,
- loaded variables / functions as well as their values
edit: RStudio also has the possibility to edit keyboard shortcuts. Nice 🙂
Simple plots are relatively easy to generate. The one you can see in the screenshot was generated by
## Aufgabe 16
# In einem Test wird die Nullhypothese, dass für eine bestimmte Altersgruppe
# mit n Personen die durchschnittliche Punktzahl θ bei einem Leistungstest 40
# beträgt, gegen die Alternative, dass diese ungleich 40 ist, getestet. Sie
# können davon ausgehen, dass die erreichten Punktzahlen normalverteilt mit
# Varianz σ^2 = 36 sind.

## Aufgabe c

# Gütefunktion:
# g(\theta) = P_\theta(X \in Kritischem Bereich)
#           = P_\theta(Entscheidung für H_1)

g_a = function(theta) {
    # H_0: θ  = 40
    # H_1: θ != 40
    ifelse(theta == 40,
           pnorm(4, mean=0, sd=2) - pnorm(-4, mean=0, sd=2),
           pnorm(4, mean=abs(theta-40), sd=2) - pnorm(-4, mean=abs(theta-40), sd=2))
}

g_b = function(theta) {
    # H_0: θ  = 40
    # H_1: θ != 40
    ifelse(theta == 40,
           pnorm(2, mean=0, sd=1) - pnorm(-2, mean=0, sd=1),
           pnorm(2, mean=abs(theta-40), sd=1) - pnorm(-2, mean=abs(theta-40), sd=1))
}

curve(g_a, from=30, to=50, xlab="", ylab="", lwd=2)
curve(g_b, from=30, to=50, add=T, col="red", xlab="", lwd=2) # ist besser
title(main="Gütefunktion der Tests (a) und (b)",
      sub="Aufgabe 16",
      xlab=expression(theta),
      ylab="g_a(x) und g_b(x)")
legend("topright",
       legend=c("g_a(x)", "g_b(x)"),
       lty=c(1,1),
       lwd=c(2,2),
       col=c("black","red"))
Expected
R has a few properties which I expect from any programming language today:
- A code repository (cran.r-project.org) where people can add packages.
- R has its niche: Statistics (although I expect Python to replace R on the long run)
- R has a tutorial. In this introduction, one can also see the focus on statistics.
Bad things about R
- The name. Try searching for "R" is difficult ... "rlang" seems to work, though. But it is close to "erlang", another language. This makes searching for answers harder than necessary.
There seems to be no possibility to run an R script from console like: This is simply wrong. If you edit the keyboard shortcuts ("run all code"), you can see it. But I have to say that it's pretty well-hidden 😉 (Thanks to Tariq for correcting me!)python script.py.- There seems to be no possibility to run an R script completely within rstudio. I've seen users who know R for several years pressing ctrl+enter for every single line to execute the script line by line.
- Unusual syntax:
- Indexing starts with
1, not with0. - Assignment:
<-instead of=(see this)
- Indexing starts with
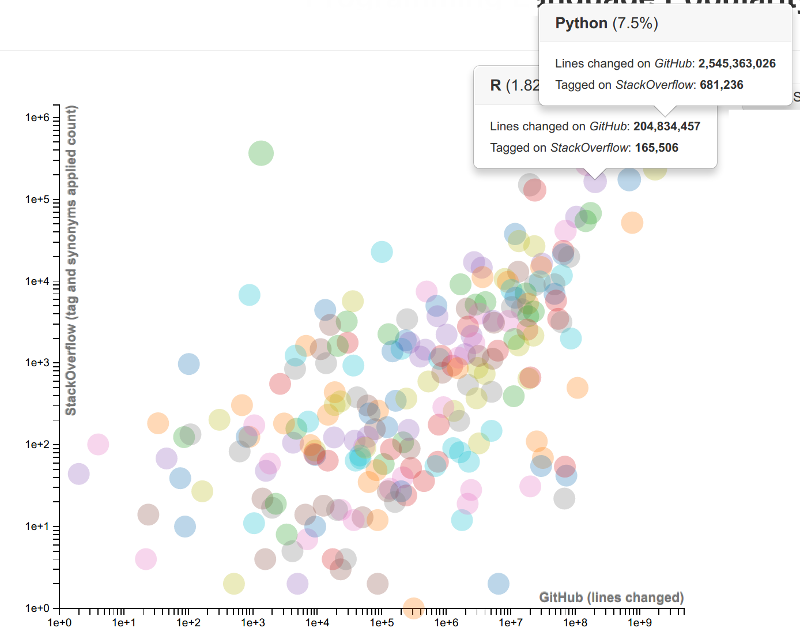
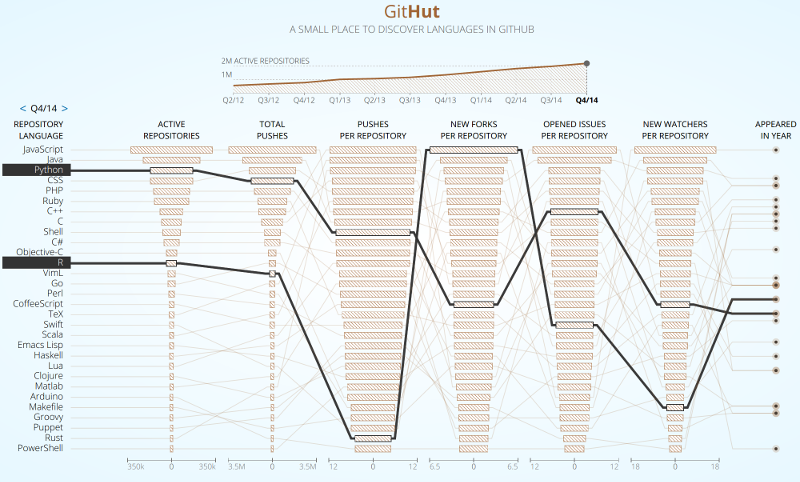
Community
Why Python can replace R
One thing mentioned all the time as a reason to use R are nice visualizations which are easy to create.
Well, in Python there is matplotlib and seaborn (as well as ggplot, bokeh, pygal, geoplotlib, gleam, missingo, leather, and many other libraries for visualization).
For example, the plot from above can be made with matplotlib like this:
#!/usr/bin/env python
# -*- coding: utf-8 -*-

r"""
# Aufgabe 16

In einem Test wird die Nullhypothese, dass für eine bestimmte Altersgruppe
mit n Personen die durchschnittliche Punktzahl θ bei einem Leistungstest 40
beträgt, gegen die Alternative, dass diese ungleich 40 ist, getestet. Sie
können davon ausgehen, dass die erreichten Punktzahlen normalverteilt mit
Varianz σ^2 = 36 sind.

## Aufgabe c

Gütefunktion:
g(\theta) = P_\theta(X \in Kritischem Bereich)
          = P_\theta(Entscheidung für H_1)
"""

import numpy as np
import matplotlib.pyplot as plt
from scipy.stats import norm


def g(thetas, sd, x):
    """
    Calculate the probability between [-x, x] of a random variable.

    H_0: θ  = 40
    H_1: θ != 40
    """
    values = []
    for theta in thetas:
        if theta == 40:
            mean = 0
        else:
            mean = abs(theta - 40)
        rv = norm(mean, sd)
        values.append(rv.cdf(x) - rv.cdf(-x))
    return values


def main(xmin=30, xmax=50, samples=100):
    """Create plots."""
    x = np.linspace(xmin, xmax, samples)  # sample 100 values between 30 and 50
    plt.plot(x, g(x, sd=2, x=4), color="#000000", label="$g_a(x)$")
    plt.plot(x, g(x, sd=1, x=2), color="#ff0000", label="$g_b(x)$")
    plt.title("Gütefunktion der Tests (a) und (b)", fontweight="bold")
    plt.xlabel(r"""$\theta$""")
    plt.ylabel(r"""$g_a(x)$ und $g_b(x)$""")
    plt.legend()
    plt.suptitle("Aufgabe 16")
    plt.show()


if __name__ == "__main__":
    main()
which results in
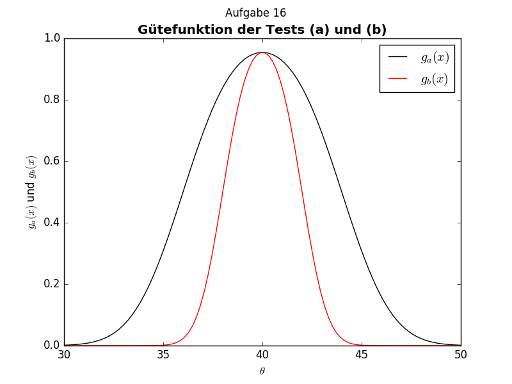
To me, the Python code seems much cleaner, easier to understand and to adjust to other cases. And it can be easily imported from other scripts / executed at once.
Another point which is mentioned quite often is the support for various
statistical functions. Well, there is scipy.stats.
I challenge R users to name a function they really need / used in R which is
not available in Python.
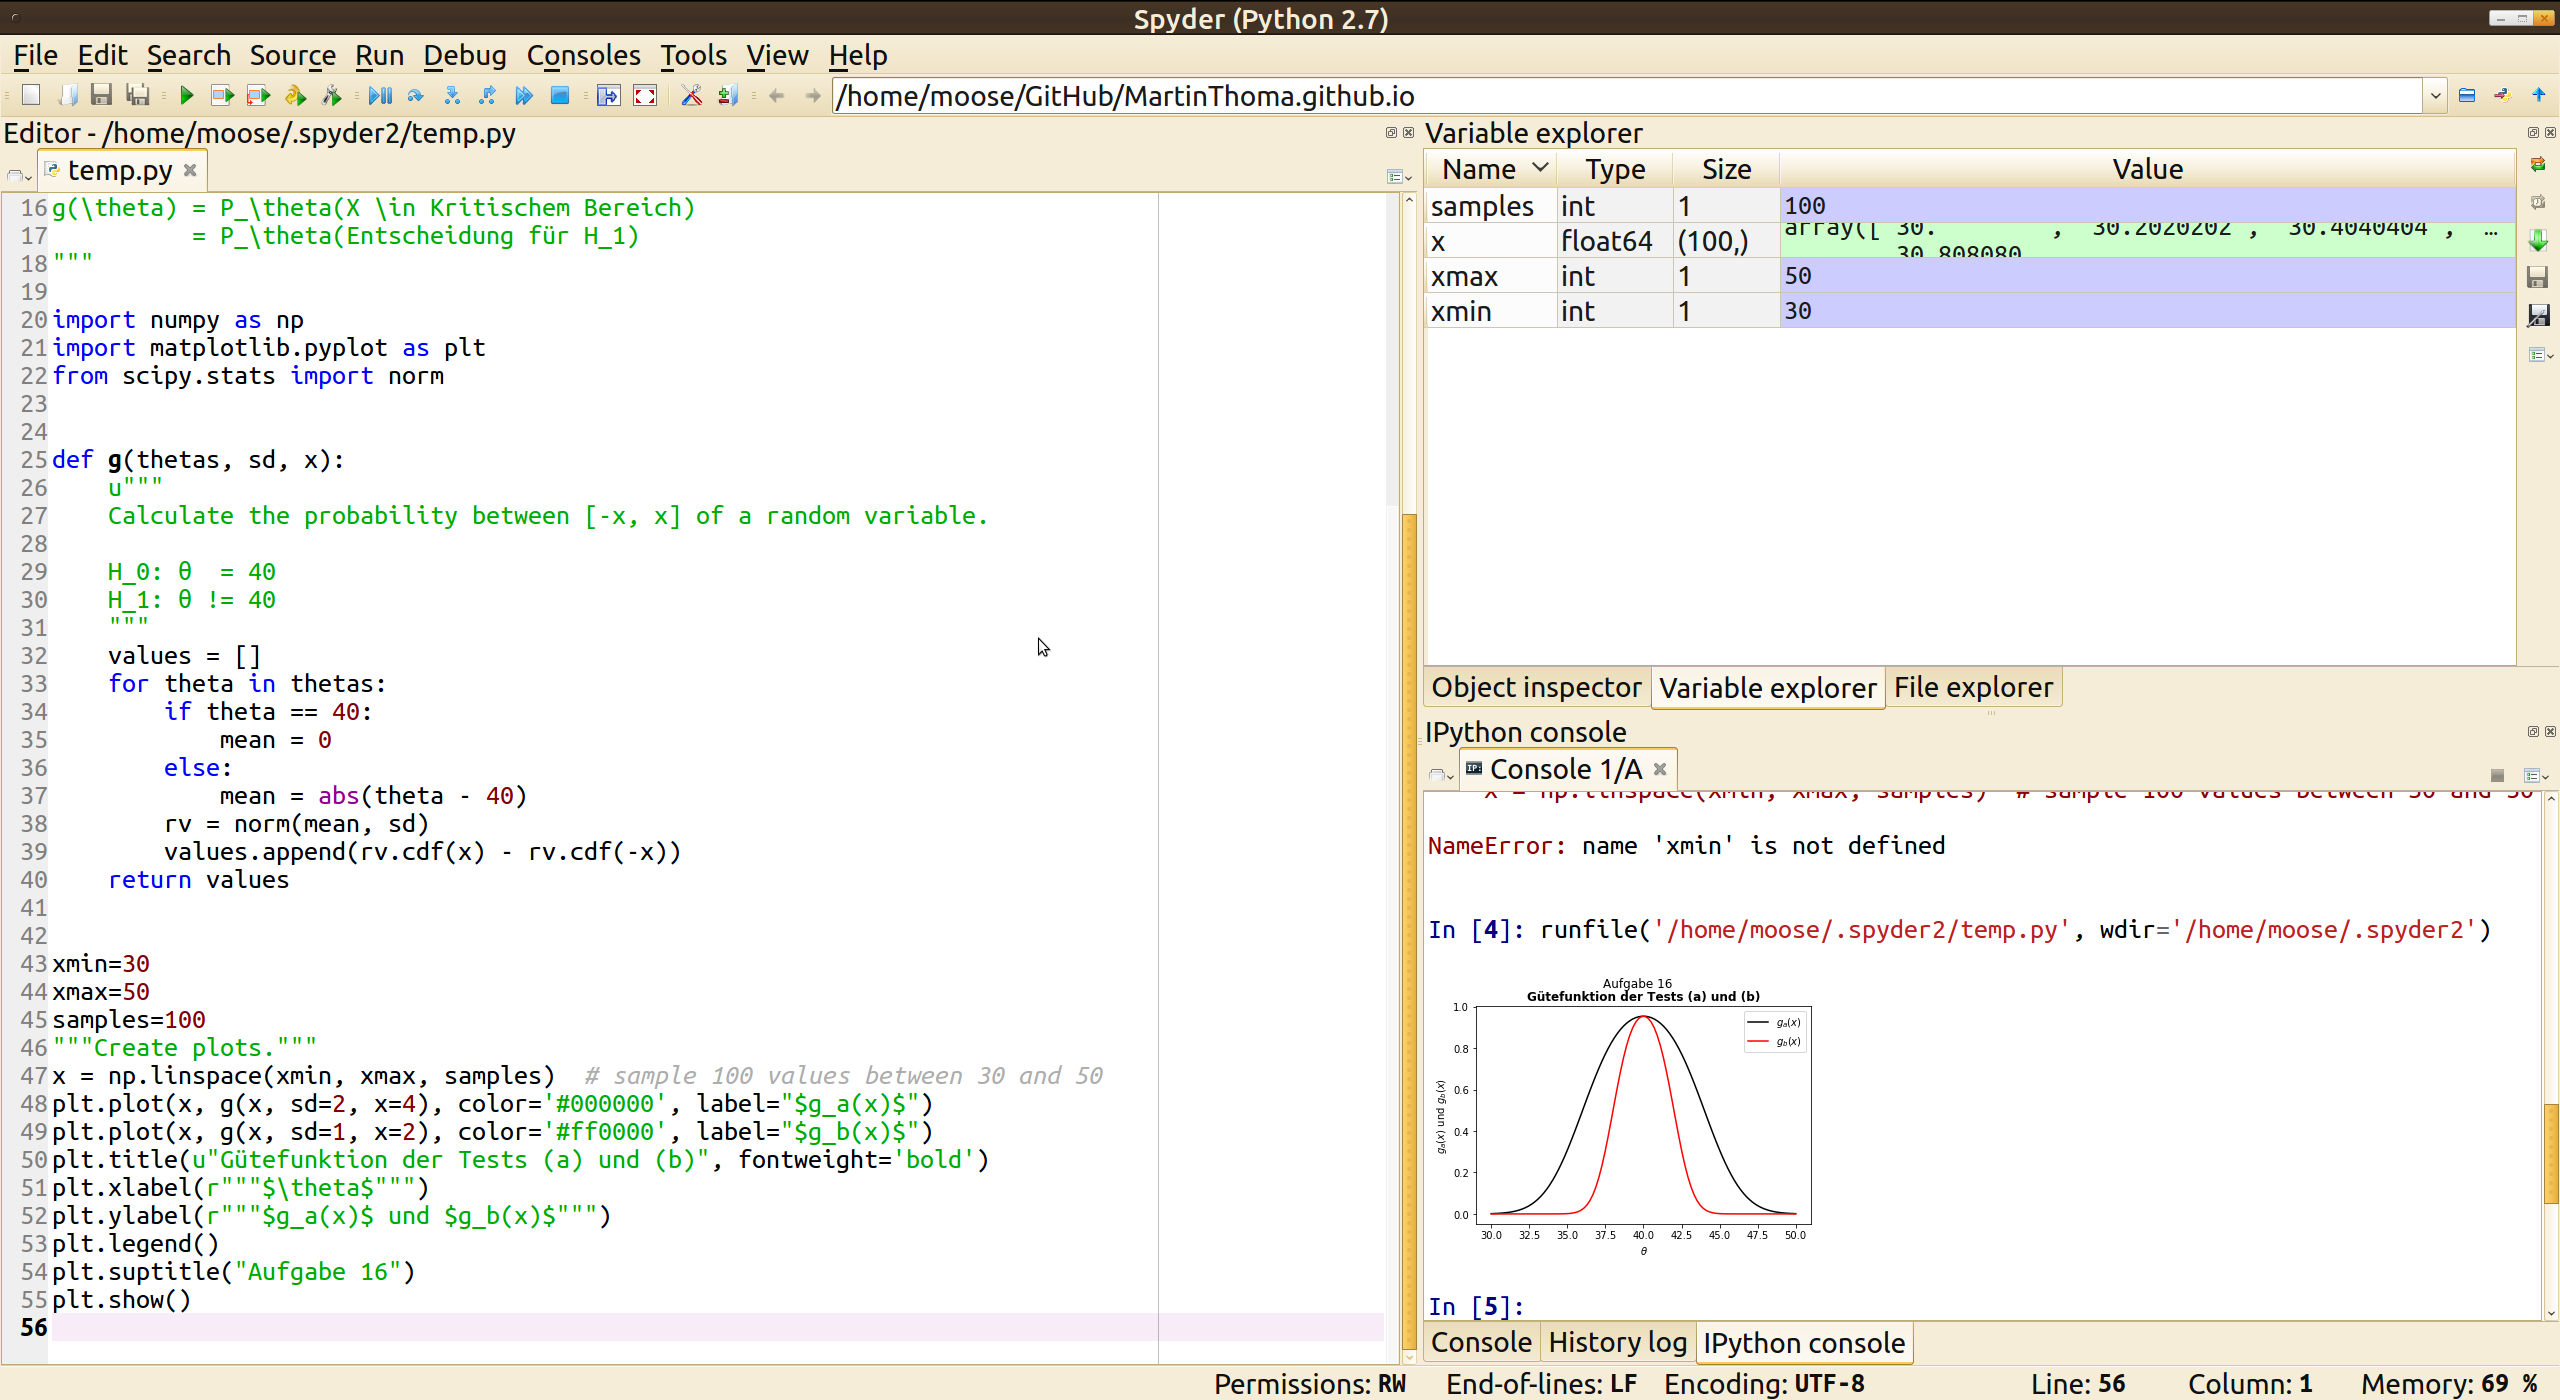
In case the nice GUI is an argument to use R: Try Spyder:
rpy2
You can access R data with rpy2.
from rpy2.robjects import r
from rpy2.robjects import pandas2ri


def data(name):
    return pandas2ri.ri2py(r[name])


df = data("iris")
print(df.describe())
Python - R dictionary
| Python | R | Explanation |
|---|---|---|
scipy.stats.norm(0, 2).cdf(4) |
pnorm(4, mean=0, sd=2) |
Cumulative Density function at 4 of a normal distributed variable with mean 0 and standard deviation 2. |
Links
- stats.stackexchange.com
- Manuals, especially thisR-lang.html
- www.r-tutor.com
- tryr.codeschool.com
- www.cyclismo.org/tutorial/R